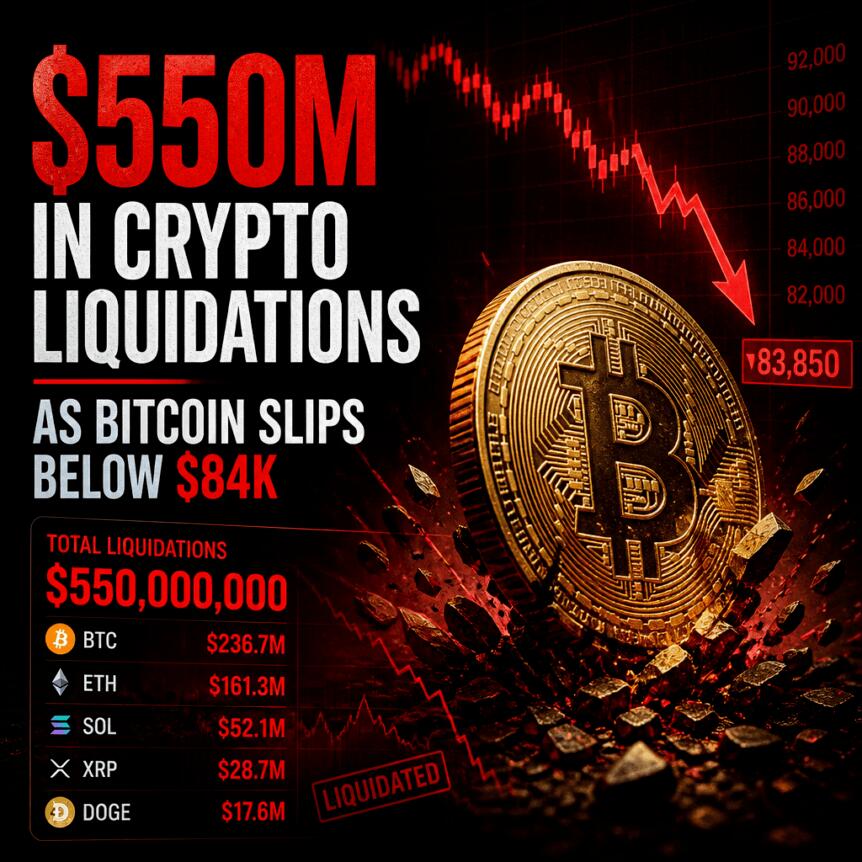
Bitcoin slipped below $84,000 on Wednesday, triggering a wave of forced selling in leveraged derivatives. According to CoinGlass data cited in the reporting, flash liquidations across crypto
Bitcoin slipped below $84,000 on Wednesday, triggering a wave of forced selling in leveraged derivatives. According to CoinGlass data cited in the reporting, flash liquidations across crypto totaled over $550 million—mostly tied to long positions—amid a short-term drop that briefly pushed BTC to about $83,560.
Despite the selloff, traders appeared to find buyers near the 21-day moving average, which is currently around $83,850. As price stabilized in the low-$84,000 area, analysts highlighted both a key technical line for bulls and a specific pattern of highly leveraged short activity on Hyperliquid immediately before the downside accelerated.
Key takeaways
- Bitcoin briefly tagged $83,560 before holding support around its 21-day SMA near $83,850.
- CoinGlass data showed cumulative crypto long liquidations of roughly $550 million during the move.
- Lookonchain and other onchain analysis flagged four Hyperliquid wallets that opened 40x BTC shorts before the decline.
- Rekt Capital said a daily or three-day close above $86,700 is needed to validate upside continuation.
- Open interest rebounded after the liquidation flush, suggesting traders returned to risk even near local lows.
Liquidations flare as BTC breaks down briefly
Market data from TradingView showed BTC/USD falling as much as 2.3% over two hourly candles before snapping back toward the $84,000 level. At the time of writing, Bitcoin was trading around that area, but the move was significant enough to force large positions off margin.
CoinGlass figures cited in the original reporting put cumulative 24-hour crypto long liquidations at approximately $550 million. In fast markets, those liquidation cascades can exaggerate price swings—especially when leverage is concentrated—creating the kind of sharp downside that can happen even without a deeper change in broader trend.
Hyperliquid 40x shorts reportedly led the move
One of the more actionable elements in the coverage was an onchain-linked timing analysis pointing to concentrated leverage on a single venue. According to onchain observations attributed to Lookonchain and others, four wallets opened shorts using USD Coin (USDC) on Hyperliquid for a total of 148.49 BTC, using 40x leverage, shortly before the downside occurred.
This kind of “positioning before the move” matters to market participants because it can help explain why certain price levels break quickly. When highly leveraged traders enter in the same direction, they may amplify order-book pressure once liquidity thins and stops get triggered.
After the liquidation flush, the same reporting noted that open interest started to rebound across the exchanges tracked by CoinGlass. Specifically, open interest reportedly rose from around $54.2 billion to $55.3 billion over a six-hour window between 4 a.m. and 10 a.m. UTC. While open interest can rise for both long and short positions, the implication here is that traders appeared willing to re-engage around local lows instead of stepping entirely aside.
The 21-day moving average holds—what comes next
Technical analysis centered on Bitcoin’s nearby trend support. The 21-day simple moving average (SMA) near $83,850 acted as a key reference point during the dip. As the coverage described, bulls on lower time frames are watching this level closely, treating it as a near-term “line in the sand.”
Earlier coverage referenced in the original article had framed the 21-day SMA as a critical boundary for maintaining momentum. In the latest reaction to Wednesday’s drop, Bitcoin held close to that zone, keeping the market from entering a more damaging breakdown scenario immediately.
Below the 21-day SMA, the next widely discussed area was $82,500, described as a decisive level for Bitcoin’s broader uptrend. The reporting ties that level to an inverse head-and-shoulders structure that remains incomplete on the weekly chart, noting that price previously visited $82,500 on Sept. 28. For traders using pattern-based frameworks, this matters because the market’s next reaction at $83,850 and potentially $82,500 could determine whether the larger reversal thesis keeps playing out or loses structure.
Confirmation threshold at $86,700
Even with support holding, analysts argued that upside follow-through is not yet confirmed. Rekt Capital—cited in the original reporting—said Bitcoin needs stronger higher-time-frame validation to continue its bullish setup. In particular, he emphasized that a daily close, or at least a close over three days, above $86,700 would be required.
Rekt Capital also stated that Bitcoin currently lacked “lower timeframe confirmation” relative to the key continuation level, implying that while the market may have bounced from local support, it had not yet proven the shift in momentum necessary to sustain a recovery.
That distinction—holding support versus confirming continuation—often separates “relief rallies” from actual trend progression. A move back above $86,700 on daily structure would likely be seen as a cleaner signal that buyers can defend higher levels without immediate rejection.
Why traders will watch the next few sessions
With leverage-driven volatility already demonstrated by the liquidation totals and the reported Hyperliquid short activity, attention should move to whether Bitcoin can hold the 21-day SMA region and then build toward a daily (or multi-day) close above $86,700. The near-term risk is a second test of $82,500 if support fails; the upside case hinges on reclaiming resistance with enough market structure to avoid another stop-driven flush.
This article was originally published as $550M in Crypto Liquidations as Bitcoin Slips Below $84K on Crypto Breaking News – your trusted source for crypto news, Bitcoin news, and blockchain updates.