AAVE Breakout Setup approaches a key technical level after weeks of recovery from June lows. The daily chart shows price testing descending channel resistance after strong bullish momentum re
- AAVE Breakout Setup approaches a key technical level after weeks of recovery from June lows.
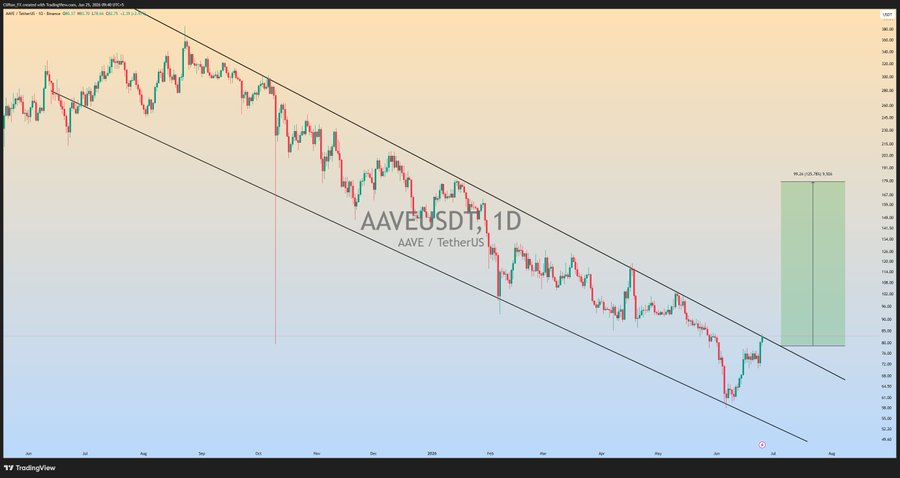
- The daily chart shows price testing descending channel resistance after strong bullish momentum returned.
- Trading volume surged over 139%, supporting renewed buying activity across the market.
AAVE Breakout Setup remains in focus as traders monitor a key technical level, while improving momentum, rising volume, and strengthening market structure place the asset near a potentially decisive point.
Daily Chart Approaches Critical Resistance
AAVE continues trading within a descending channel on the daily chart. That structure has guided price action since mid-2025. Lower highs and lower lows defined the broader trend.
A market update from clifton_ideas pointed to growing breakout potential. The post noted AAVE was testing channel resistance. A confirmed breakout could trigger a stronger bullish phase.
Source:
XPrevious recovery attempts failed near the upper trendline. Sellers repeatedly defended resistance throughout the prolonged decline. As a result, bearish control remained intact for months.
Current conditions appear different from earlier rejection attempts. Price recently rebounded from the channel floor. Buyers returned aggressively after June's sharp decline.
Recovery Rally Strengthens Market Structure
AAVE as of the time of writing, traded at $81.64 after posting a strong daily advance. The token gained approximately 7.48% during the session. That performance exceeded many major digital assets.
The rally began after a drop toward the $72 region. Selling pressure briefly accelerated during the decline. However, buyers quickly absorbed available supply.
Price subsequently reclaimed several short-term resistance levels. Momentum improved after the asset crossed the $78 area. The advance eventually carried AAVE above $80.

The session later produced a move toward $84-$85. That area became the day's highest trading zone. Profit-taking emerged afterward but remained relatively contained.
Volume and Fundamentals Support Recovery
Trading activity increased sharply alongside the latest advance. Twenty-four-hour volume rose more than 139% during the move. Rising participation often accompanies stronger market conviction.
Market capitalization climbed to approximately $1.25 billion. At the same time, Total Value Locked reached $12.41 billion. The protocol continues maintaining a substantial decentralized finance presence.
The broader chart structure also shows gradual improvement. Higher lows have started replacing previous lower lows. This shift suggests increasing buyer activity across recent weeks.
Attention now remains focused on channel resistance. A decisive daily close above that level could alter trend dynamics. Until confirmation arrives, the breakout attempt remains under evaluation.
Technical projections displayed on the chart identify a higher target zone. That area extends toward the $170-$190 range. Such projections depend on a confirmed breakout and sustained momentum.
For now, market participants are watching resistance closely. Buyers have regained short-term control after June's recovery. The next major signal may emerge from price action near channel resistance.