AAVE has rallied sharply since late August, and the coin now sits inside a tightening triangle that has capped its momentum for weeks. This is why the AAVE price prediction for the coming day
AAVE has rallied sharply since late August, and the coin now sits inside a tightening triangle that has capped its momentum for weeks.
This is why the AAVE price prediction for the coming days carries real weight, since a decisive move out of this structure looks close.
Aave coin is the native governance and utility token of the Aave protocol, one of the largest decentralized lending platforms in crypto.
The protocol lets users lend and borrow digital assets without a centralized intermediary, and AAVE has remained a widely tracked token among decentralized finance investors.
AAVE trades near $126.51, up 1.9 percent over the past 24 hours.
The price moved between $123.81 and $127.67 during that window, keeping aave price today close to its highest levels of the past several weeks.
AAVE Live Market Data
Metric
Value
Price
$126.51
24h Change
+1.9%
24h Range
$123.81 - $127.67
Market Cap
$1.952B
Fully Diluted Valuation
$2.024B
24h Trading Volume
$188.173M
Total Value Locked
$18.267B
Circulating Supply
15.428M
Total Supply
16M
Max Supply
16M
Source: AAVE market data taken from CoinGecko, as of Sep 14, 2026. Figures may vary slightly across other tracking websites.
AAVE Liquidation Data
Timeframe
Total Liquidated
Longs
Shorts
1H
$1.24K
$1.22K
$12.72
4H
$3.36K
$1.65K
$1.71K
12H
$15.18K
$11.37K
$3.80K
24H
$136.02K
$110.44K
$25.58K
Source: Liquidation Data Taken From CoinGlass, As of Sept 14, 2026.
The liquidation data over the past 24 hours leans toward longs, with $110.44K of the $136.02K total coming from long positions compared to $25.58K on the short side.
The shorter one-hour and four-hour windows show a more balanced picture, suggesting today's imbalance built up mostly over the past half day rather than in a single sharp move.
This kind of pattern often shows up when price rallies into resistance and stalls, pushing over-leveraged buyers to exit before a clear breakout confirms.
AAVE Exchange Volume
Futures volume for AAVE remains concentrated on a handful of major exchanges. Binance leads with $59.44 million in 24-hour volume, followed by BingX at $42.88 million and Bybit at $24.31 million.
OKX and WhiteBIT each contribute over $15 million, while MEXC, Bitunix, Bitget, and Hyperliquid round out the rest of the activity. 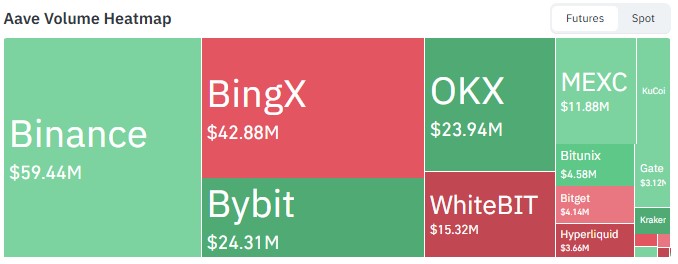
Source: Volume Heatmap Data Taken From CoinGlass, As of Sept 14, 2026.
This spread of liquidity, alongside steady AAVE news today and interest around the protocol's lending activity, suggests trading demand remains broad rather than concentrated on one venue.
AAVE Price Prediction: Technical Analysis
On the daily chart, $AAVE is trading inside a symmetrical triangle, a pattern formed by a falling trendline above and a rising trendline below that are gradually converging.
Price has already tested the falling trendline once and pulled back slightly, keeping the structure intact. 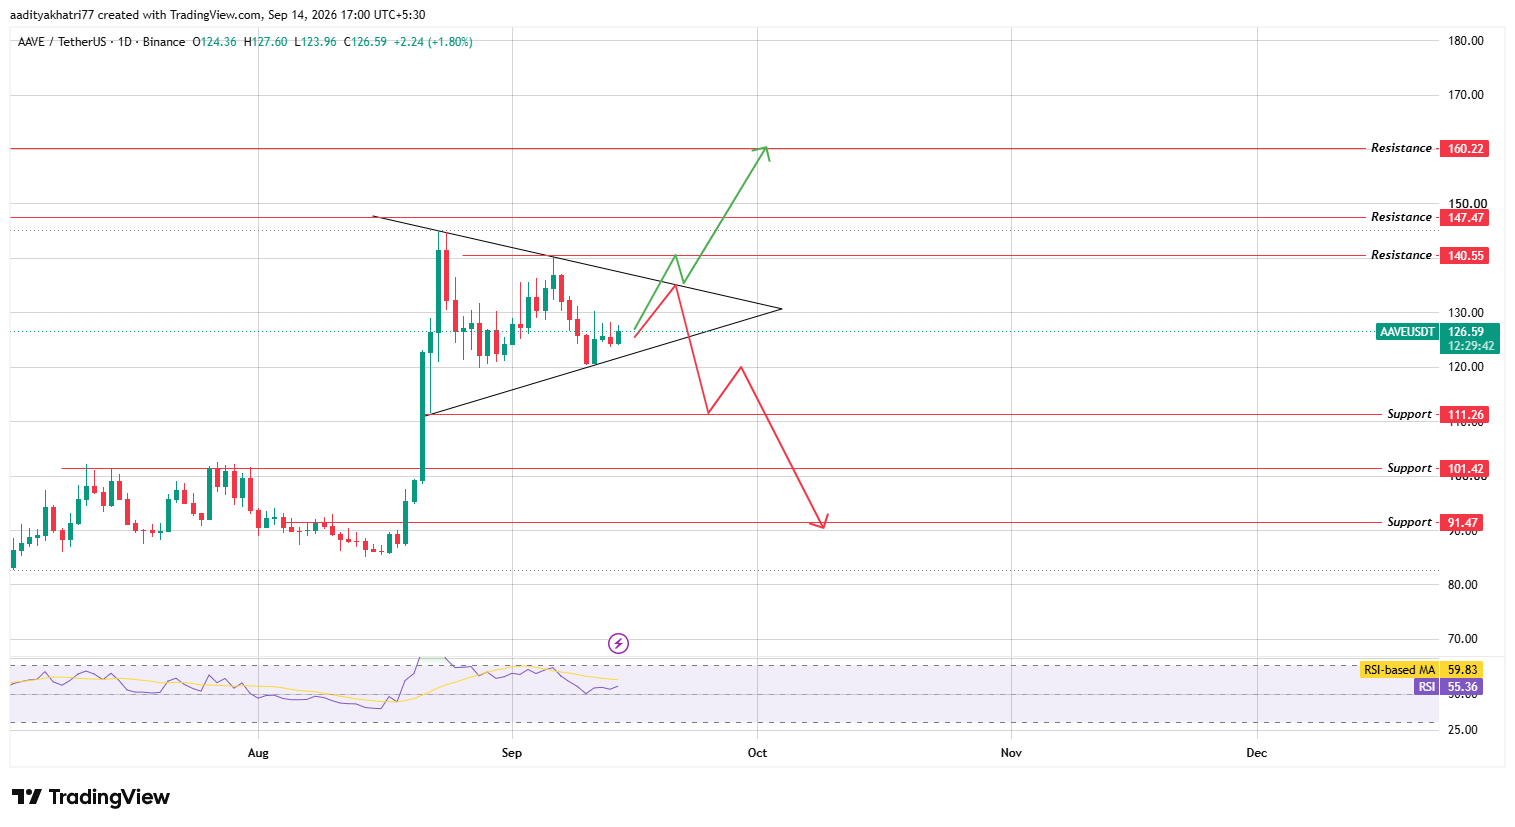
Source: Chart taken from TradingView, as of Sep 14, 2026
RSI sits at 55.36 with its moving average at 59.83, reflecting steady but not extended bullish momentum.
This kind of close aave setup means the next daily close could determine AAVE's direction for weeks to come, shaping the broader AAVE price prediction 2026 outlook.
Could $AAVE Break Towards Higher Resistance?
A daily close above the falling trendline, backed by rising volume, would confirm a bullish breakout from the symmetrical triangle.
That kind of move could carry the price toward $140.55 first. A sustained push through that level would put $147.47 in sight, and continued strength could extend the rally toward $160.22.
What Happens If $AAVE Gets Rejected and Breaks Down?
If $AAVE instead gets rejected from the falling trendline, the price would likely pull back toward the rising trendline of the triangle.
A confirmed break below that rising trendline would open the door toward $111.26, and continued weakness could extend the decline toward $101.42 and eventually $91.47.
Support and Resistance Levels
Support
Resistance
$111.26
$140.55
$101.42
$147.47
$91.47
$160.22
Bull, Base, and Bear Scenarios
Scenario
Setup
Level
Bull
Daily close above the falling trendline with rising volume
$140.55 – $160.22
Base
Price holds inside the symmetrical triangle
$111.26 – $140.55
Bear
Rejection from the trendline followed by a break of the rising trendline
$91.47
AAVE vs Bitcoin
AAVE's price tends to move with more volatility than Bitcoin, reflecting its smaller size relative to the broader crypto market despite its standing as a leading decentralized finance token.
When Bitcoin holds steady or trends higher, tokens like Aave coin typically get more room to attempt breakouts such as the one currently forming.
A sharp move lower in Bitcoin would likely pressure AAVE's triangle support faster than any AAVE price prediction outlook 2026 based purely on AAVE's own chart could account for.
Anyone following this AAVE price prediction should watch Bitcoin's broader trend before assuming AAVE breaks out on its own.
Methodology
This AAVE price prediction is based on the daily AAVEUSDT chart from Binance via TradingView, using the symmetrical triangle structure, RSI readings, and the marked support and resistance levels as the primary technical inputs.
Liquidation and exchange volume data came from Coinglass, and market data such as price, market capitalization, and supply figures came from CoinGecko.
This Aave price prediction 2026 outlook reflects current technical conditions only, and none of the levels discussed should be treated as guaranteed.
Expert Opinion
Market commentators tracking $AAVE's recent structure have generally noted that symmetrical triangles following a sharp prior rally often resolve in the direction of the original trend, though a rejection at resistance remains a real possibility given how far price has already climbed since late August.
Several analysts following decentralized finance tokens have pointed to AAVE's protocol activity as a factor that could support renewed buying interest if the triangle resolves higher.
Disclaimer: This article is for informational purposes only and does not constitute financial advice. Cryptocurrency markets, including AAVE, are highly volatile, and prices can move against any technical setup discussed here. Support and resistance levels are not guaranteed to hold, and actual price action may fall well outside the scenarios described. Readers should conduct their own research and consult a licensed financial advisor before making any investment decisions.