For most of this year, $AAVE traders got used to watching the token drift lower in a tightening range, every rally fading before it went anywhere. That pattern just broke. A sudden push highe
For most of this year, $AAVE traders got used to watching the token drift lower in a tightening range, every rally fading before it went anywhere.
That pattern just broke. A sudden push higher has pulled $AAVE out of its long-term descending channel, and the question now is whether this is a real trend change or another short-lived bounce.
This Aave price prediction breaks down what the charts, the derivatives data, and the protocol's revenue story are saying about where $AAVE could head next.
Why Is Everyone Suddenly Talking About Aave Again?
Part of the renewed attention comes from outside the chart. Aave's official account confirmed that deposits on EtherFi's $Aave V4 deployment crossed 100 million dollars within its first week, a sign the newest lending layer is finding real demand.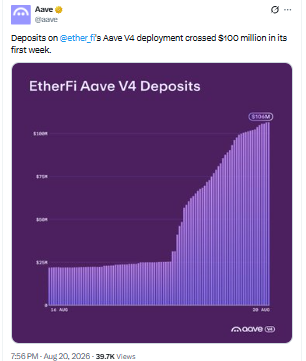
Combined with the ongoing rollout of $Aave V4's hub-and-spoke architecture, the GHO stablecoin, and the Horizon initiative bringing real-world assets onto the protocol, AAVE price prediction discussions are no longer only about charts.
Is AAVE Breaking Out of Its Long-Term Downtrend?
According to TradingView daily chart, AAVE has traded inside a descending channel for a long stretch, with lower highs capping every recovery attempt.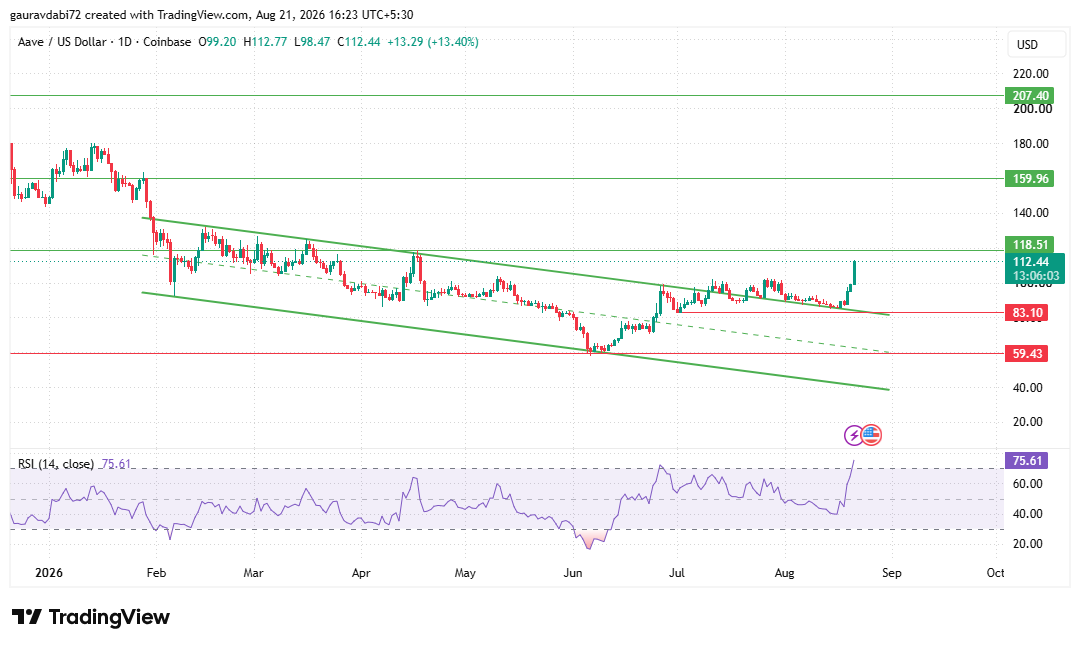
That picture just changed. Price is now trading above the channel's upper trendline, and buyers have stepped in with enough force to hold that reclaimed area as support instead of letting it flip back into resistance.
A clean breakout like this, after such a prolonged downtrend, is usually the first technical clue that sentiment is shifting.
What Do the AAVE Support and Resistance Levels Look Like Now?
With the descending channel breached, the next resistance for this $Aave price prediction sits at 118.51, followed by 159.96 and 207.40 if momentum keeps building.
On the downside, 83.10 and 59.43 stand out as key support levels, with 83.10 lining up closely with the broken channel line.
If AAVE cannot sustain fresh strength, consolidation between roughly 83 and 118 is possible, something the coin has not shown in a long time.
Is AAVE's RSI Signaling Overbought Territory?
The daily RSI has jumped sharply to 75.61, moving well into overbought territory after months in a cooler 40 to 60 range.
A reading this high alongside a strong candle usually reflects genuine buying pressure, but it also raises the odds of a short-term pullback before the next leg higher.
For this $AAVE price prediction, the RSI spike supports the idea that momentum has shifted while also hinting a pause near 118.51 would not be unusual.
What Is Happening in the AAVE Derivatives Market?
According to CoinGlass, open interest stood near 304.38 million dollars, well up from earlier in the year, with 24-hour liquidations near 2.01 million dollars, split between about 218.72K in longs and 1.79 million in shorts.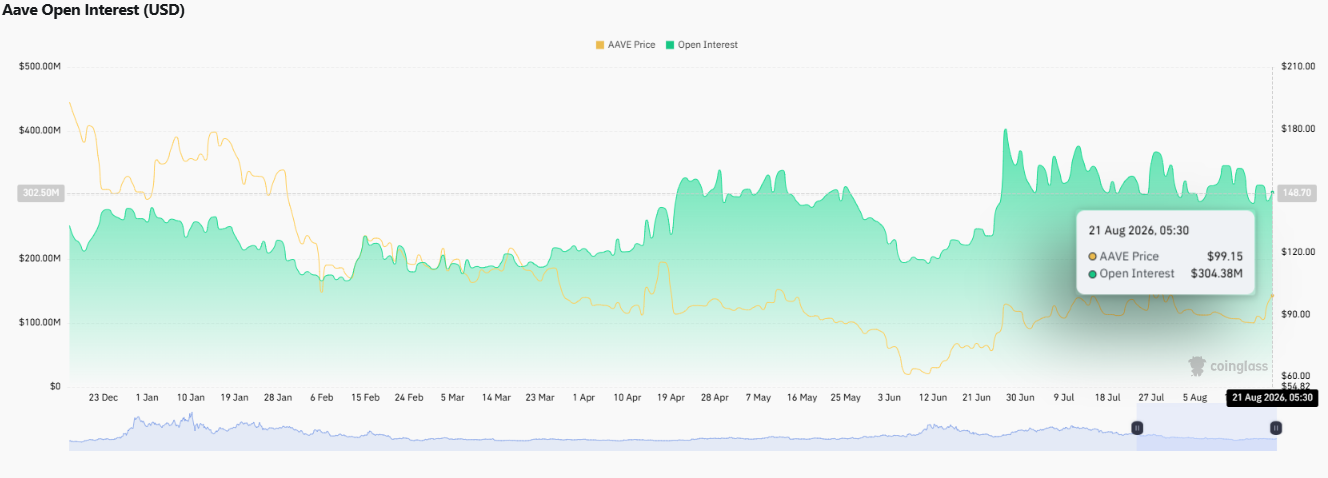
Long-to-short account ratios on Binance and OKX lean toward longs at 1.5873 and 1.27, and Binance top trader positioning shows a similar lean at 1.6767 for accounts.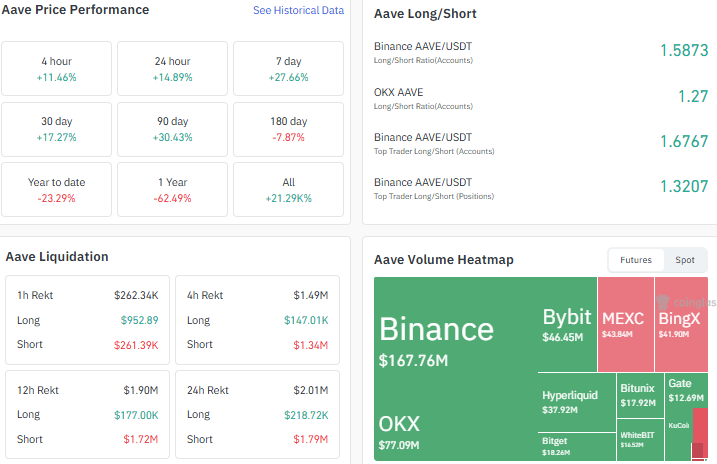
Futures volume stays concentrated on Binance near 167.76 million dollars.
Zooming out, the 30-day gain stands at 17.27 percent and the 90-day gain at 30.43 percent, while the 180-day change is still negative at 7.87 percent.
Year to date, AAVE remains down 23.29 percent, and on a 1-year view it is down 62.49 percent, a reminder of how deep the drawdown has been.
Where Does AAVE's Market Cap and Valuation Stand Today?
According to CoinMarketCap, AAVE's market cap sits near 1.72 billion dollars, up 14.73 percent over the past day, against a fully diluted valuation near 1.78 billion dollars.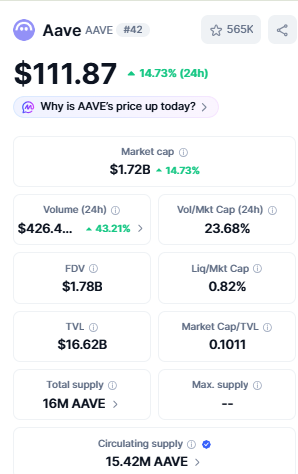
24-hour volume is near 426.4 million dollars, putting volume to market cap at 23.68 percent.
The circulating supply is roughly 15.42 million $AAVE of a 16 million total supply, with no max supply set. TVL is reported near 16.62 billion dollars, a market cap to TVL ratio near 0.1011.
Aave Price Prediction: What Could the Coming Months Look Like?
Putting the technical and fundamental pieces together, this $Aave price prediction leans toward a market shifting from a pure downtrend to a more constructive, two-way setup.
A move through 118.51 opens the door toward 159.96 and eventually 207.40, while losing the reclaimed channel line could send $AAVE back toward the 83.10 to 59.43 zone.
A sideways stretch between 83 and 118 remains a realistic middle scenario.
Expert Opinion
According to CoinGabbar, analysts note that AAVE's breakout above its multi-month descending channel is technically meaningful, given how overbought the RSI has become in such a short span. Analysts tracking the DeFi lending sector point to Aave's expanding V4 rollout and rising TVL relative to market cap as a fundamental backdrop many peers lack. Observers caution that a low market cap to TVL ratio alone does not guarantee a re-rating, and follow-through above resistance is needed to confirm a trend reversal.
Disclaimer: This article is for informational purposes only and should not be treated as financial, investment or trading advice. Cryptocurrency markets, including AAVE, are highly volatile, and past performance does not guarantee future results. Readers should conduct their own research before making any investment decisions.