AKE has dropped nearly 20% in a day, and with a token unlock landing in days, this is the kind of setup that either scares traders off or draws in the ones looking to buy a dip before new sup
AKE has dropped nearly 20% in a day, and with a token unlock landing in days, this is the kind of setup that either scares traders off or draws in the ones looking to buy a dip before new supply hits.
Akedo is a Web3 collectible gaming project, and AKE is its native token, used across the game's economy and rewards.
This AKEDO Price Prediction looks at whether the recent channel breakdown holds or reverses and what the upcoming unlock could mean for price from here.
Market data was checked on August 18, 2026, at 10:58 IST.
AKEDO Price Prediction: Market Overview
Metric
Value
Price
$0.0083259
Change
-20%
Market Cap
$190.22M
FDV
$837.18M
24h Volume
$27.76M
Vol/Mkt Cap (24h)
14.55%
Liquidity/Mkt Cap
0.93%
Total Supply
100B AKE
Max Supply
100B $AKE
Circulating Supply
22.79B $AKE
Holders
37.82K
Source: Data from CoinMarketCap as of August 18, 2026, at 10:58 IST. Figures may vary slightly across other tracking websites.
AKE Crypto News Today: Why Liquidations and Volume Are Important
Liquidations show how much leveraged money got forced out and which side lost.
Longs dominate every single window here: $8.94K long vs $54.63 short at 1h, $53.95K vs $3.28K at 4h, $418.38K vs $64.08K at 12h, and $441.94K vs $131.18K at 24h.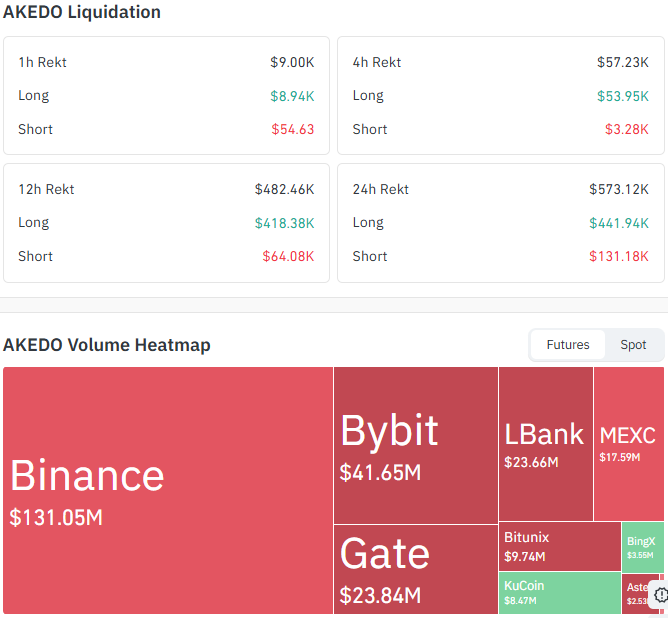
Source: Data From CoinGlass
That's a consistent long-side flush, meaning leveraged buyers keep getting caught out as price falls, which can either clear the way for a bounce once the flushing slows or signal more downside if it keeps building.
Volume shows where trading is concentrated and how liquid the market really is. Binance carries the biggest share here.
Rising volume during a drop confirms real selling, while fading volume on a bounce suggests the recovery lacks real conviction behind it.
AKE Token Unlock: What's Coming on August 21
Upcoming unlock event
Date: August 21, 2026, 2 days away from the reference date
Size: 2.11 billion tokens being unlocked, which is 2.11% of AKE's max supply
Value: roughly $17.57M, equal to about 9.25% of the current market cap
Breakdown by allocation category
Round
total % supply unlocked
Token amount
Community
+2.04%
~642.60M tokens
Investors
+4.00%
~1.00B tokens
Early Contributors
+2.33%
~348.90M tokens
Advisors
+2.33%
~116.30M tokens
Overall unlock progress
43% of the total AKE supply has been unlocked so far
That's 45.12B tokens, worth about $376.19M at current prices
The remaining ~57% is still locked and will release over time (vesting for investors, team, advisors, etc.)
Why this matters: Token unlocks increase circulating supply.
When a big chunk unlocks at once, it can create sell pressure and push the price down if demand doesn't absorb the new supply.
AKE Price Prediction Chart: Technical Analysis
Pair: AKE/USD · Market: Spot (Crypto, aggregated feed) · Timeframe: 4H · Source: TradingView · Timestamp: August 18, 2026, 10:58 UTC+5:30
AKE is trading at $0.0083259, after breaking below a descending channel that had contained price since the sharp rally on August 13 to 14.
Price pulled back steadily inside that channel through mid-August before breaking below its lower boundary and is now testing support just under it.
RSI (Relative Strength Index) reads 44.53, below the neutral 50 mark, showing momentum has weakened alongside the breakdown but isn't deeply oversold yet.
The EMA (Exponential Moving Average) cluster sits above the current price, with the shorter EMA at $0.0092917 and the longer EMA at $0.0079002, meaning the price is currently trading between the two, using the longer EMA as a level to hold and the shorter EMA as resistance to reclaim.
If the price breaks the channel in the upward direction, we could see further upside.
However, if it breaks below the channel, we may see further downside. 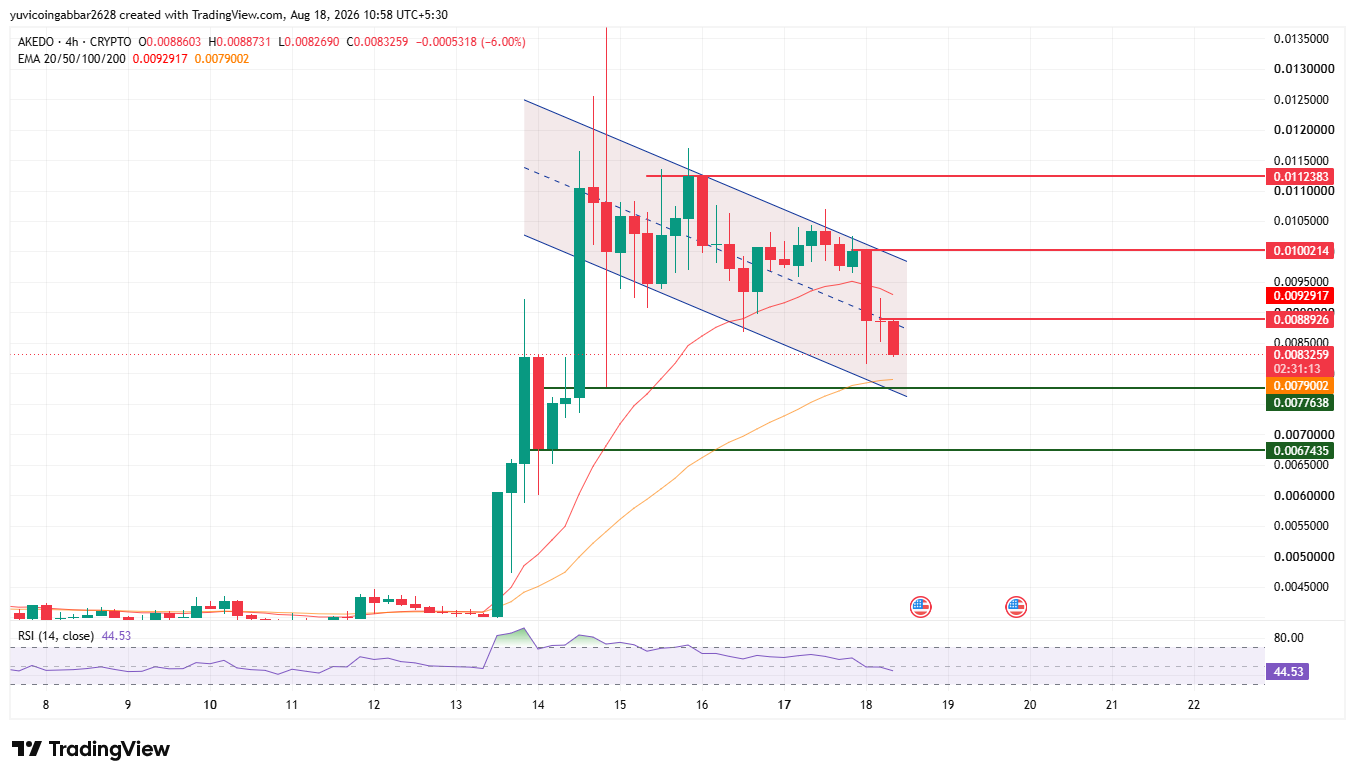
AKE Future Price: Important Key Trading Levels
Level Type
Price
Resistance 3
$0.0112383
Resistance 2
$0.0100214
Resistance 1 (nearest)
$0.0088926
Immediate Price Reference
$0.0083259
First Support
$0.0077638
Deeper Support
$0.0067435
AKE EMA Levels
EMA
Price
EMA (shorter)
$0.0092917
EMA (longer)
$0.0079002
AKEDO Forecast: Bull Case vs. Bear Case
AKE price target 2026 Bull case: Holding above the first confirmed support at $0.0077638 and reclaiming the shorter EMA at $0.0092917 would suggest the channel breakdown was a shakeout rather than the start of a deeper slide.
A confirmed move above the nearest resistance at $0.0088926 would open the path toward $0.0100214 and eventually $0.0112383.
AKE price target 2026 Bear case: A break below $0.0077638 would confirm the channel breakdown is continuing, especially with the token unlock adding fresh supply into the market.
Losing $0.0067435 would mark a much deeper retracement from the mid-August highs.
Price Scenarios: Triggers and Invalidation
Scenario
Trigger
Likely Outcome
Invalidation Point
EMA reclaim
Close above $0.0092917
The path opens toward $0.0100214 and $0.0112383
Rejection back below $0.0079002
Support zone hold
Price stays above $0.0077638
Consolidation continues near current levels.
Close below $0.0077638
Support zone breakdown
Close below $0.0077638
Drop toward $0.0067435
Reclaim of $0.0077638
AKE Price Target: Can AKE Reach $0.0112383?
$0.0112383 is the highest resistance level marked on the chart.
Reaching it would require AKE to first reclaim the EMA cluster near $0.0079002 to $0.0092917, clear the nearest resistance at $0.0088926, then break and hold above $0.0100214, a multi-stage recovery rather than a quick move, especially with new supply arriving from the August 21 unlock.
What Could Invalidate the Bullish Setup?
A rejection at the EMA cluster near $0.0079002 to $0.0092917 followed by a close back below the first confirmed support at $0.0077638 would put any recovery attempt in question.
A deeper break below $0.0067435 would undermine the setup entirely, particularly if unlock-related selling adds pressure around August 21.
AKEDO Price Prediction 2026: Expert Analysis
According to CoinGabbar analysts,AKE's breakdown below its descending channel came alongside a token unlock just days away, a combination that tends to keep upside capped until the new supply is absorbed.
RSI at 44.53 shows the sell-off has slowed but hasn't reversed, and price is now sitting right at the first confirmed support near $0.0077638.
With only 43% of max supply currently unlocked and this event releasing 9.25% of market cap worth of tokens in one go, near-term price action likely depends more on how the market absorbs that unlock than on the chart pattern alone.
Liquidity relative to market cap is thin at 0.93%, which can make the reaction sharper than usual in either direction.
Disclaimer: This piece is for informational purposes only and isn't financial advice. The levels and scenarios above are based on technical chart analysis and publicly available data at the time of writing, and crypto markets can move sharply within hours, so past patterns don't guarantee future outcomes. It's worth doing independent research and considering your own risk tolerance before acting on any of the levels discussed here.