AKEDO Price Prediction: Can AKE Hold Gains After This Breakout Move A tiny gaming token just did something most of the market missed. AKE broke out of a months-long falling channel this week,
AKEDO Price Prediction: Can AKE Hold Gains After This Breakout Move
A tiny gaming token just did something most of the market missed. AKE broke out of a months-long falling channel this week, and traders who'd written it off are watching again. Volume spiked, and liquidations piled up on both sides.
It's a fast story, built on thin liquidity and speculative capital rotating into small-cap tokens. So where does AKE stand, and how far can this run go?
AKE Just Broke Out. Here Is What Happens Next
AKEDO price prediction talk has picked up fast this week, starting with a chart pattern breaking in real time. $AKE spent months sliding lower inside a descending channel, a squeeze pattern where each rally gets weaker than the last. That squeeze just ended.
Buyers pushed price above the channel line on rising volume, with real conviction behind it. But breakouts on micro-caps fail often too. What would prove this one wrong?
Key Takeaways
Direction: AKE broke above its descending channel and is trending bullish on the daily chart.
Why: Rotation of speculative capital into micro-caps, plus thin liquidity, is driving outsized swings.
Short-term range: A move toward $0.0007 to $0.0009 looks possible if volume holds.
Invalidation: A daily close back below $0.00017 undoes the bullish structure.
AKEDO Snapshot: Price and Market Cap Right Now
As of the latest snapshot at 14:16 UTC, $AKE traded near $0.00058, up roughly 208% over 24 hours depending on the source checked.
MetricValueCoin NameAKEDOTickerAKEBlockchainBNB Smart Chain (BEP-20)Today High$0.00074695Today Low$0.00018626RSI Level (14)73.21Token TypeUtility / GamingMarket CapApproximately $13.05M24H VolumeApproximately $24.2MCirculating Supply22.79B AKEMax Supply100B AKE24H Change+208%
Price and market data per CoinMarketCap style tracking and TradingView chart data. Holder figures sourced from BscScan.
What Is AKEDO and Why the AKE Token Exists
AKEDO is an AI game creation platform on BNB Smart Chain, letting users prompt and publish playable games. $AKE powers creation, staking, and liquidity across the ecosystem.
$AKE Price History and Recent Performance
AKE's all-time high sits near $0.003244, set in late September 2025, so it still trades roughly 82% below that peak. Its all-time low came just days ago near $0.00017, now the line in the sand for this bullish case.
Why AKEDO Is Getting So Much Attention Today
AKE was confirmed as part of the Binance Alpha Box airdrop alongside Ultiland (ARTX), giving eligible Alpha point holders a direct claim path and pulling in fresh eyes fast.

Source: Posted on X by @akedofun
But the bigger driver looks broader than AKEDO alone. This is part of a sector-wide rotation into volatile micro-caps, tied to the samebroader market rally that's lifted names like TrumpCoin by similar triple-digit spikes the same week. Basically, retail money is chasing volatility, and AKE sat in a compressed, oversold setup when that wave hit.
AKE Liquidation Data Shows Who Got Squeezed
Over the past 24 hours, AKE liquidations totaled roughly $4.71M, split between $669.07K in longs and $4.04M in shorts, as per CoinGlass data. Turns out most of that damage hit in a single 4-hour window, where shorts alone lost $3.90M, a pattern not unlike the recentwhale selloff pressure seen on other Binance-listed micro-caps.
Fundamental Analysis: AKE Tokenomics Explained
$AKE has a fixed supply of 100 billion tokens, unlocking over four years. The community gets 31.5% across node, creator, and player rewards, mostly vesting over 48 months.
Investors hold 25%, released after a 3-month cliff. Ecosystem and growth get 17.5%, mostly unlocked at launch. Contributors and advisors combine for 20% under 6-month cliffs, with 1% out as a community airdrop.
That's a lot of future supply still working into circulation, worth weighing against any long-term thesis.
Source: Data by bscscan
AKE Technical Setup: RSI, EMA, and Channel Break
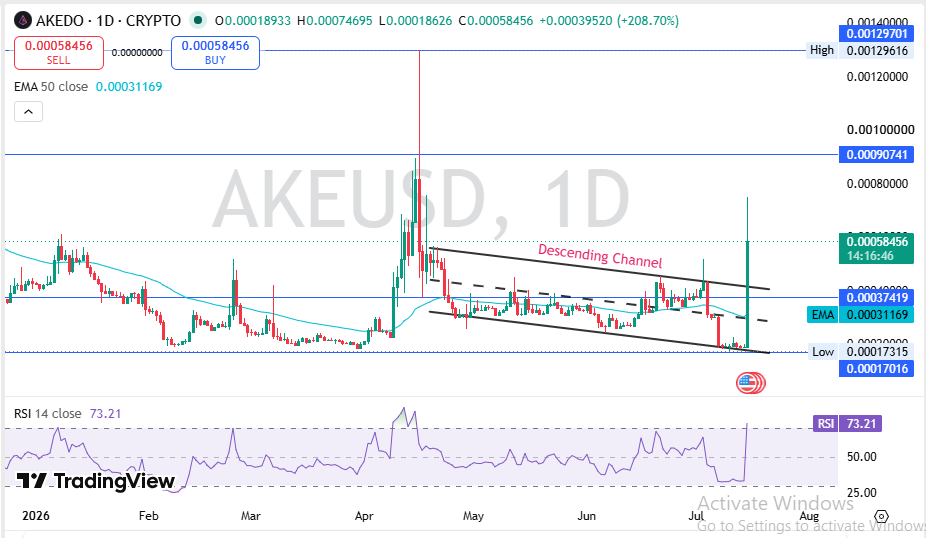
Price broke above a descending channel while trading above its 50 EMA (exponential moving average, a smoothed trend line) near $0.000374, suggesting buyers are setting the pace.
Souce: TradingView
RSI (Relative Strength Index, a momentum gauge where readings above 70 flag overbought conditions) reads 73.21: stretched, not extreme, but chasing this candle blindly carries pullback risk.
Support sits near $0.000374.
Resistance clusters at $0.000907 and then $0.001297. As per the TradingView chart structure, the pattern resembles thefalling wedge breakout setups showing up on other small caps, and it favors upside unless the $0.00017 floor breaks.
AKEDO Volume Heatmap Across Major Exchanges
Trading is concentrated on Binance, carrying roughly $303.06M of AKE volume, with LBank ($91.01M) and Bybit ($74.26M) trailing, as per CoinGlass tracking. Gate, Bitunix, and MEXC handle smaller slices, and the split across thesemajor crypto exchanges shows liquidity is far from evenly spread.
How AKEDO Compares to Other Micro Cap Rotations
AKE isn't moving alone. It echoes the recenttoken rotation surge seen elsewhere, with TrumpCoin posting a comparable 267% move in the same window. What separates $AKE is a concrete utility hook: an AI game platform with real published output, not a pure narrative play. That's something to fall back on if the wave fades, though it doesn't guarantee better liquidity.
AKEDO Short-Term Price Prediction This Month
The setup favors continuation while volume stays elevated and price holds above the broken channel line. A rejection at resistance could stall momentum fast, given an overbought RSI.
TimeframeBearishBaseBullishKey Trigger24 Hours$0.00045$0.00062$0.00074Volume follow-through above $20M3-7 Days$0.00037$0.00068$0.00090Weekly close above 50 EMA2-4 Weeks$0.00030$0.00075$0.00100Sustained buying past first resistance
These ranges come from current support and resistance zones plus how RSI has cooled off after similar readings before, much like thekey level to watch approach used for larger caps. Watch $0.000374 closely: it separates a real trend change from a failed spike.
AKEDO Long-Term Price Prediction Through 2027
Longer term, $AKE's fate depends less on this week's volume spike and more on real platform usage and how the remaining supply unlocks over the coming years.
TimeframeBearishBaseBullishCatalyst Needed3 Months$0.00020$0.00055$0.00150Continued listings and Alpha Box exposure6 Months$0.00015$0.00060$0.00140Growing prompt/publish activity on-platformEnd of Year$0.00012$0.00070$0.00180Unlock schedule absorbed without heavy selling2027 Outlook$0.00010$0.00085$0.00250Real ecosystem revenue feeding staking and burn
Honestly, the burn and staking mechanics give $AKE more of a real economic loop than most rotation-driven micro-caps get. But with 98.82% top-holder concentration and years of unlocks ahead, this stays a high-risk hold, not a set-and-forget position.
Three Price Scenarios for AKE From Here
Each scenario below hinges on the same two things: whether $0.000374 support holds and whether volume stays elevated enough to carry price through resistance.
ScenarioPrice RangeWhat Triggers ItWorst Case$0.00012 - $0.00017Break of $0.000374 support, volume collapseBase Case$0.00045 - $0.00075Sideways digestion, no new catalystBest Case$0.00090 - $0.00130+Volume-backed breakout past resistanceKey Price Levels to Watch on AKE Chart
Resistance zone:$0.000907, then $0.001297. A confirmed close above the first on strong volume opens the path toward the second.
Support zone: $0.000374, the former channel ceiling now acting as a floor. Holding here keeps the bullish structure intact.
Invalidation zone:$0.00017016. A daily close beyond this breaks the current thesis and calls for reassessment.
Risk Factors Every AKE Holder Should Know
Liquidity risk: Liquidity near 8% of market cap means large orders can move this market fast either way.
Volatility risk: Top 100 wallets hold 98.82% of supply; whales alone control 99.96%. That mirrors thewhale concentration risk flagged on other thin-float tokens, and a handful of holders can swing price hard.
What breaks the thesis:A close below $0.00017, a drop in exchange volume, or unlocks hitting the market faster than demand absorbs them.
Analyst View and Final Thoughts on AKEDO
This AKEDO price prediction hinges on one test: does $0.000374 hold as support on a pullback? Everything bullish here rests on that line.
RSI at 73.21 says buyers are in control but also flags a market that ran hot fast. Checking theFear and Greed Index alongside this chart is worth doing before chasing the move. A weekly close above the 50 EMA would confirm this has legs beyond one volatile session.
One thing worth tracking outside the chart: whether Binance Alpha Box exposure keeps pulling fresh demand or fades once the claim window closes. Turns out the volume behind this breakout is the most convincing part of the story, more than the price move itself.
The setup leans bullish, and this take says so plainly: as long as $0.000374 holds, dips look more like opportunity than warning. That read expires the moment the invalidation level breaks.
Key Takeaways
AKE broke out of a months-long descending channel on strong volume.
RSI at 73.21 shows momentum with buyers, though conditions are stretched.
$0.000374 decides whether this stays a real trend or fades.
Long-term outcomes depend on unlock schedules and real platform usage.
Whale concentration and thin liquidity keep volatility risk high both ways.
Disclaimer: This article is for educational purposes only and does not constitute financial advice. Crypto markets are volatile. Consult your investment advisor before making any investment decision.