Is this jump the start of a real trend or a squeeze that fades before next week? This Akedo price prediction begins with AKE back above a support level it lost earlier this week. The earliers
Is this jump the start of a real trend or a squeeze that fades before next week?
This Akedo price prediction begins with AKE back above a support level it lost earlier this week. The earliershort squeeze or fakeout read on this site raised the same question about forced buying. The data below tests that idea.
Akedo Price Forecast: 24-Hour Market Snapshot
CoinGecko market data ranks Akedo at 199th with a market cap of $148.013M, which is the combined value of every circulating token. Akedo is an AI game token, so sector headlines ingaming crypto news can sway sentiment around the coin.
Metric
Value
Price
$0.006448
24h range
$0.0025 to $0.006708
Market cap
$148.013M
Market cap rank
199th
Fully diluted valuation (FDV)
$649.288M
24h trading volume
$148.463M
Circulating supply
22.796B AKE
Total supply
100B AKE
Max supply
100B AKE
Source: CoinGecko, captured Nov 13, 2026, 11:20 UTC
Akedo YUBIT Futures Listing: What 20x Trading Means
Futures are contracts that let traders bet on a coin's price rising or falling without owning it. Per theofficial YUBIT X post, the exchange listed AKE futures with up to 20x trading. At 20x, $1 of a trader's own money controls $20 of exposure.
Source: YUBIT official X post, captured Nov 13, 2026, 11:20 UTC
The post calls Akedo an AI game creation engine that turns text prompts into games, with no coding needed.
For this Akedo price prediction, the listing matters only if fresh traders arrive and volume keeps rising. If it doesn't, extra 20x positions can unwind fast.
Akedo Holder Concentration: Top 10 Wallets Hold 43.82%
Holder concentration shows how much supply sits in a few wallets. The top 5 wallets hold 31.24% of supply onBscScan holder data, and the top 10 hold 43.82%. Across the top 100, the share reaches 85.48%.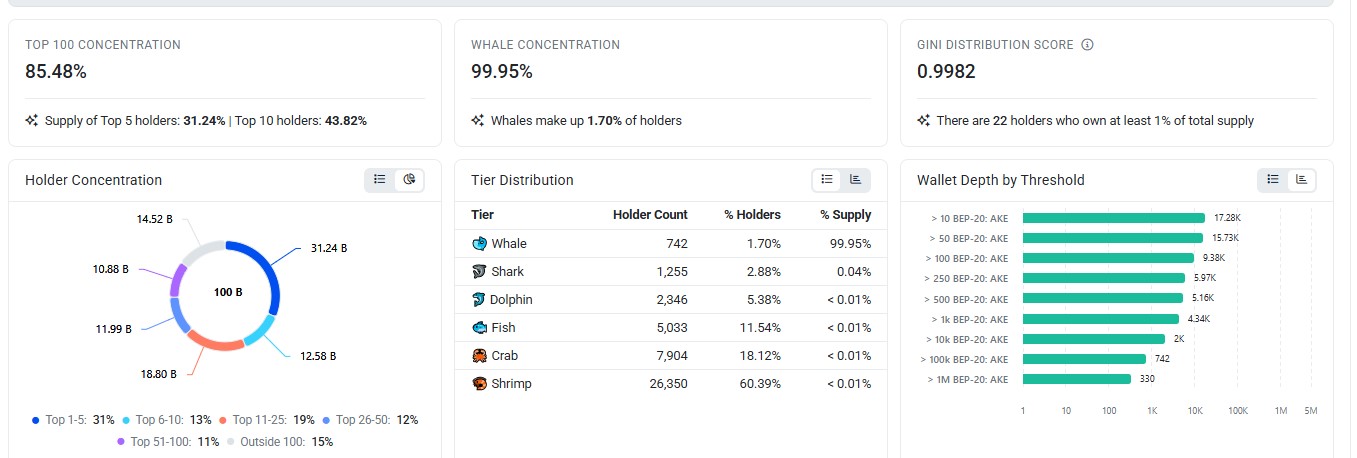
Source: BscScan holder analytics, captured Nov 13, 2026, 11:20 UTC
The Gini score, a 0 to 1 scale where 1 means one wallet owns everything, reads 0.9982.
Akedo Liquidation Data: $2.23M in Shorts Wiped Out
Shorts took the hit. Over 24 hours,CoinGlass liquidation data shows $2.94M wiped out, with $2.23M coming from shorts. A liquidation is a forced exit, where an exchange ends a borrowed-money trade after losses eat the deposit.
Window
Total
Longs
Shorts
1h
$44.87K
$29.08K
$15.79K
4h
$1.57M
$242.16K
$1.33M
12h
$2.61M
$506.85K
$2.11M
24h
$2.94M
$710.98K
$2.23M
Source: CoinGlass, captured Nov 13, 2026, 11:20 UTC
In 4 hours, $1.33M in shorts got forced out against only $242.16K in longs. But the last hour flipped, with longs losing $29.08K to $15.79K for shorts.
Forced short exits create buy orders, which push the price up and can feed a short squeeze, where forced buying lifts the price further. If longs now lead the losses, forced selling can add weight to any pullback.
Akedo Open Interest and Futures Volume: $908.72M Traded
Futures volume is the value of futures contracts traded. Across all exchanges, AKE hit $908.72M in 24 hours. That's about 6.1 times the $148.463M volume CoinGecko reports, so most of the trading is happening in futures.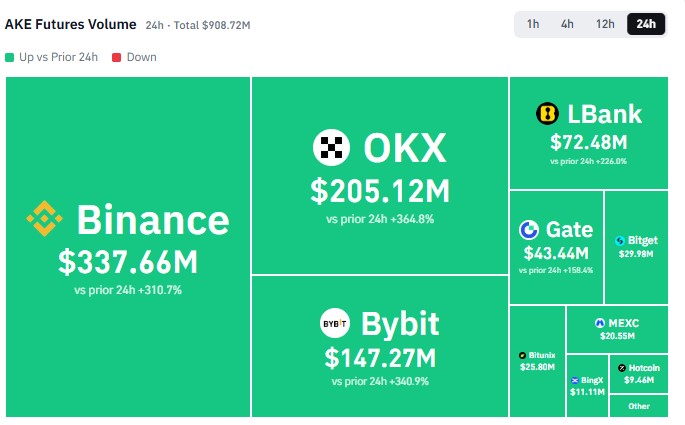
Source: CoinGlass, AKE futures volume heatmap, 24h, captured Nov 13, 2026, 11:20 UTC
Open interest is the total value of futures positions that are still open. It stands at $110.85M, spread across many exchanges.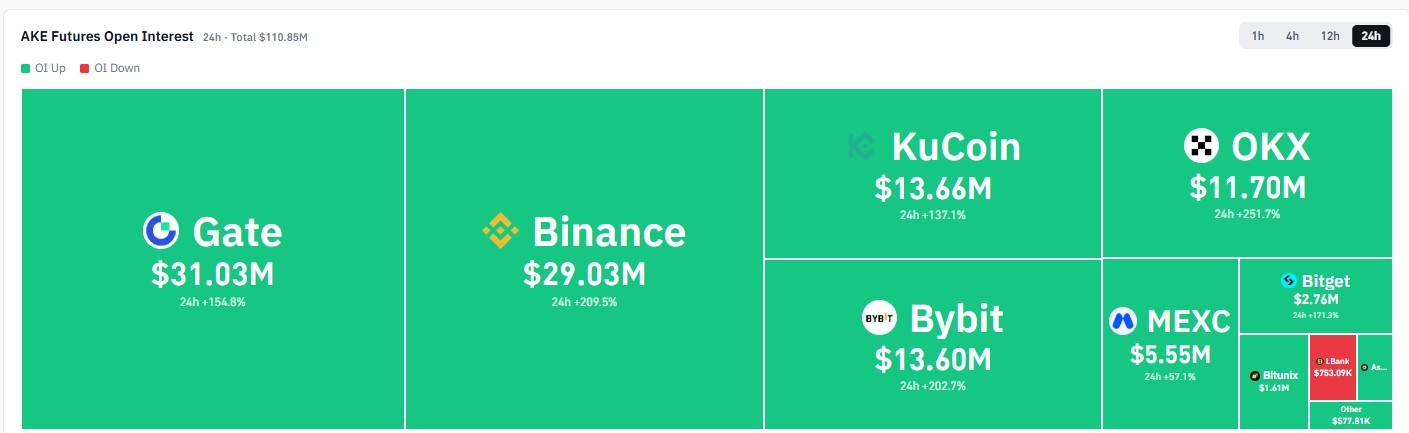
Source: CoinGlass, AKE futures open interest heatmap, 24h, captured Nov 13, 2026, 11:20 UTC
On the biggest exchanges, open interest rose between 154.8% and 251.7% over 24 hours. If it more than doubled while the price jumped, traders adding positions in a rally also add forced exits if price turns.
Akedo Technical Analysis: 50 EMA and RSI Levels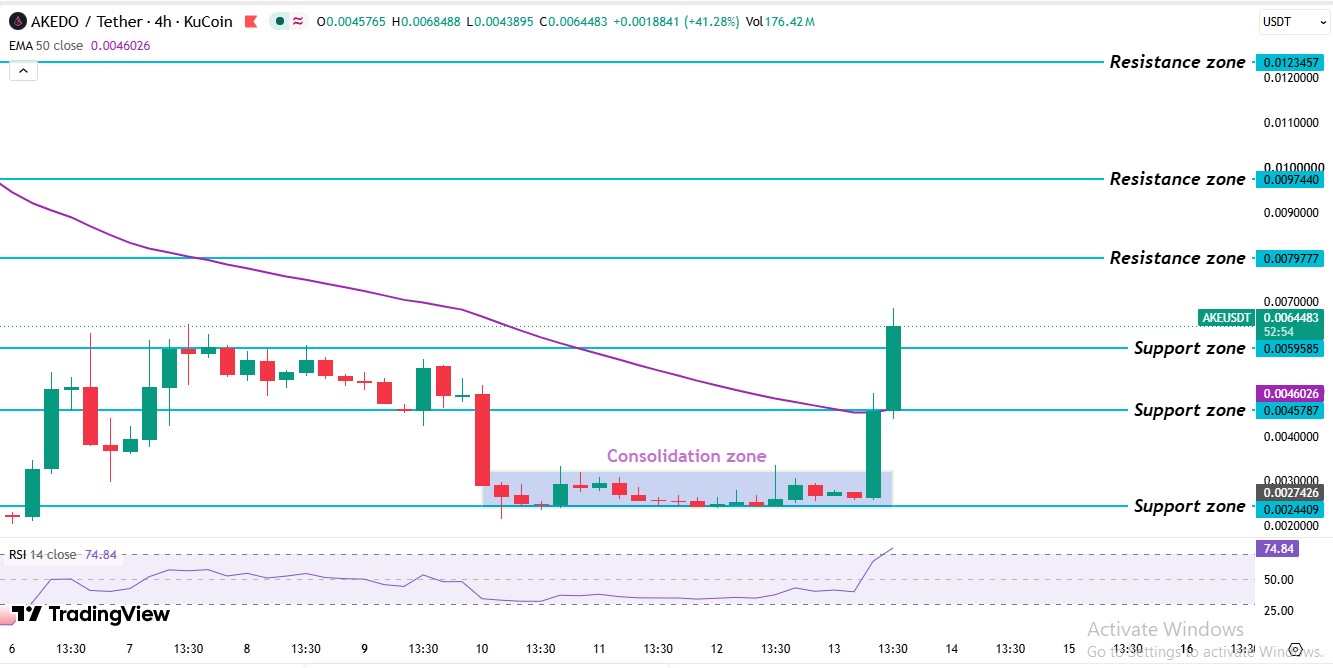
Source: TradingView, AKE/USDT 4H chart on KuCoin with EMA 50 and RSI 14, captured Nov 13, 2026, 11:20 UTC
The KuCoin 4-hour chart for AKE/USDT on TradingView frames this Akedo price prediction. A November drop pushed AKE down to the $0.0024409 support level before buyers took control.
Before the drop, the price pressed against the $0.0059585 support level several times and couldn't hold above it. A heavy red candle broke the $0.0045787 support level and ran to the $0.0024409 level. The price then traded sideways for about three days in a range, a stretch of flat trade.
A strong green candle ended that stall and lifted price back to the 50 EMA, and the latest candle ran through the $0.0059585 support level. TheOctober 2026 forecast from this site gives earlier context. Right now, the price trades above the $0.0059585 support level and the 50 EMA but under the $0.0079777 resistance level.
The AKE 50 EMA sits at $0.0046026. AKE's $0.006448 price trades 39.7% above it, and the latest candle trades above the line too, and the price has now cleared it.
The AKE RSI reads 74.84 on the 14-period setting. Above 50 means buyers hold the edge, and above 70 means buying may be stretched, so a pullback can follow.
Akedo Support and Resistance Levels
Level
Type
$0.0123457
Resistance level
$0.0097440
Resistance level
$0.0079777
Resistance level
$0.0059585
Support level
$0.0046026
50 EMA
$0.0045787
Support level
$0.0024409
Support level
Akedo Price Forecast: Bull, Base, and Bear Scenarios
Scenario
Trigger
Target
Invalidation
Bull
Daily candle trades above $0.0079777
$0.009744 than $0.0123457
Falls back below $0.0079777
Base
Price stays between $0.0059585 and $0.0079777.
Sideways trade inside that range
Daily candle breaks either level.
Bear
Daily candle trades below $0.0059585
$0.0045787
Daily candle trades above $0.0079777
A regulatory delay or an exchange rule change around futures could cut volume fast. But the technical risk comes first, since a daily candle below $0.0059585 would put the rally in doubt.
Akedo Price Prediction: Expert Outlook
According to CoinGabbar analysis, the Akedo price prediction leans cautiously bullish while the price holds above $0.0059585 because AKE has cleared the 50 EMA and shorts paid $2.23M to fuel the move. RSI at 74.84 and futures volume at 6.1 times spot volume both point to a crowded trade.
The level to monitor is $0.0059585. Daily candles that keep trading above it mean buyers hold control, and one candle below it brings the 50 EMA at $0.0046026 into play.
Disclaimer: This article is for information only and isn't financial advice. Traders should do their own research and risk only what they can afford to lose.
