After a 46% drop over 24 hours, buyers need a daily candle back above the support level at $0.0055, or the slide keeps going. This AKEDO price prediction begins with AKE trading far below its
After a 46% drop over 24 hours, buyers need a daily candle back above the support level at $0.0055, or the slide keeps going.
This AKEDO price prediction begins with AKE trading far below its earlier highs after a one-day drop. Earlier coverage of theAKEDO support and resistance levels gives the background, and the nearest support level is already under pressure. Buyers need to defend $0.0055.
How Is AKE Holding Up After a 46% Daily Drop?
CoinGlass market data shows AKEDO ranked 240th by market cap. The 24h change reads down 46.16%.
Price sits about 5% above the 24h low of $0.005136. Market cap is $133.60M. FDV is the value if all 100B tokens circulated, or $540.60M.
The spot volume of $18.23M is about 13.6% of market cap. The futures volume of $350.23M is about 19 times the spot volume and open interest. The value of open perpetual futures contracts (perps) is $38.17M, down 47.46%, so positions are closing.
What Does AKE Liquidation Data Say About Forced Selling?
Longs took the hit. A liquidation is a forced exit from a borrowed-money trade once margin runs out. CoinGlass liquidation data shows $352.70K in long liquidations over 1h against $52.07K in shorts.
Over 4h, longs lost $842.92K and shorts $196.12K. The 12h window shows $884.78K in longs and $229.59K in shorts. Across 24h, the split is $976.40K and $345.96K.
Nearly a third of the 24-hour total hit in the last hour. The snapshot lists $1.40M for 24h against $1.32M here, so the two don't match. Forced long exits add sell orders, and longs make up about 74% of the 24h total.
How Could AKE Holder Concentration Change This Analysis?
BscScan holder data puts the top 100 wallets at 86.59% of supply, a heavy holder concentration.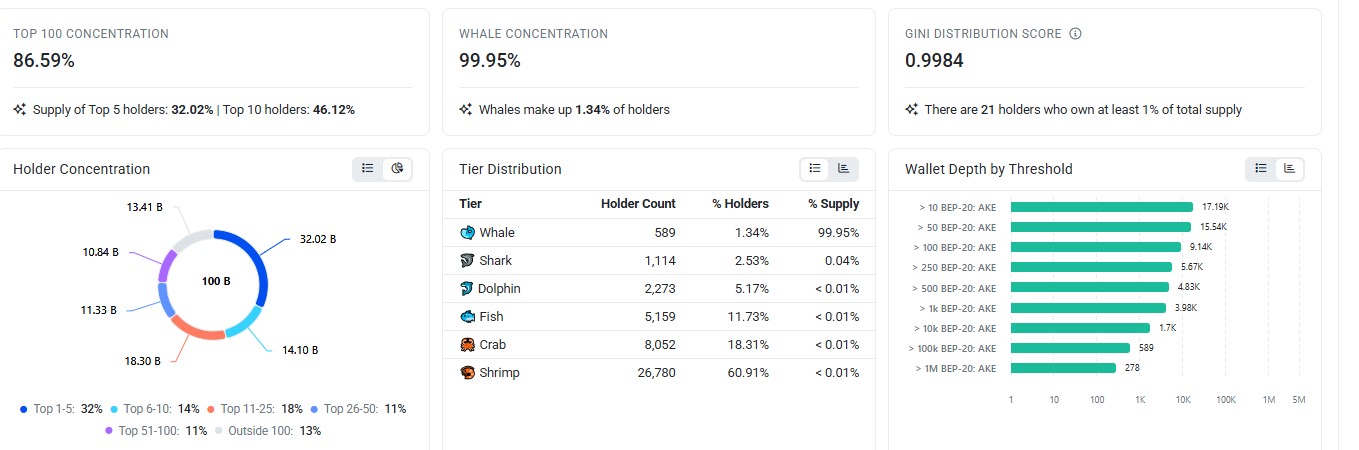
Source: BscScan holder data, captured Nov 20, 2026, 09:22 UTC
The top 5 holders own 32.02%, and the top 10 own 46.12%. Whales, meaning very large wallets, number 589 and hold 99.95%.
The tracker counts 100B tokens, while the $133.60M market cap only counts what's circulating. 21 wallets hold at least 1% each, so exchange transfers could add sell pressure.

Source: CoinGlass vesting data, captured Nov 20, 2026, 09:22 UTC
The tracker values the release at $11.26M, about 62% of spot volume. Traders can followcrypto news updates for related announcements. Investor allocations reaching wallets could add sell pressure near the support levels.
AKEDO Price Prediction: EMA, and MACD Levels
The TradingView AKEDO/Tether 4H chart on KuCoin frames this AKEDO price prediction. A sharp consolidation lifted AKE toward the $0.0182 resistance level, and sellers took control after the rejection there.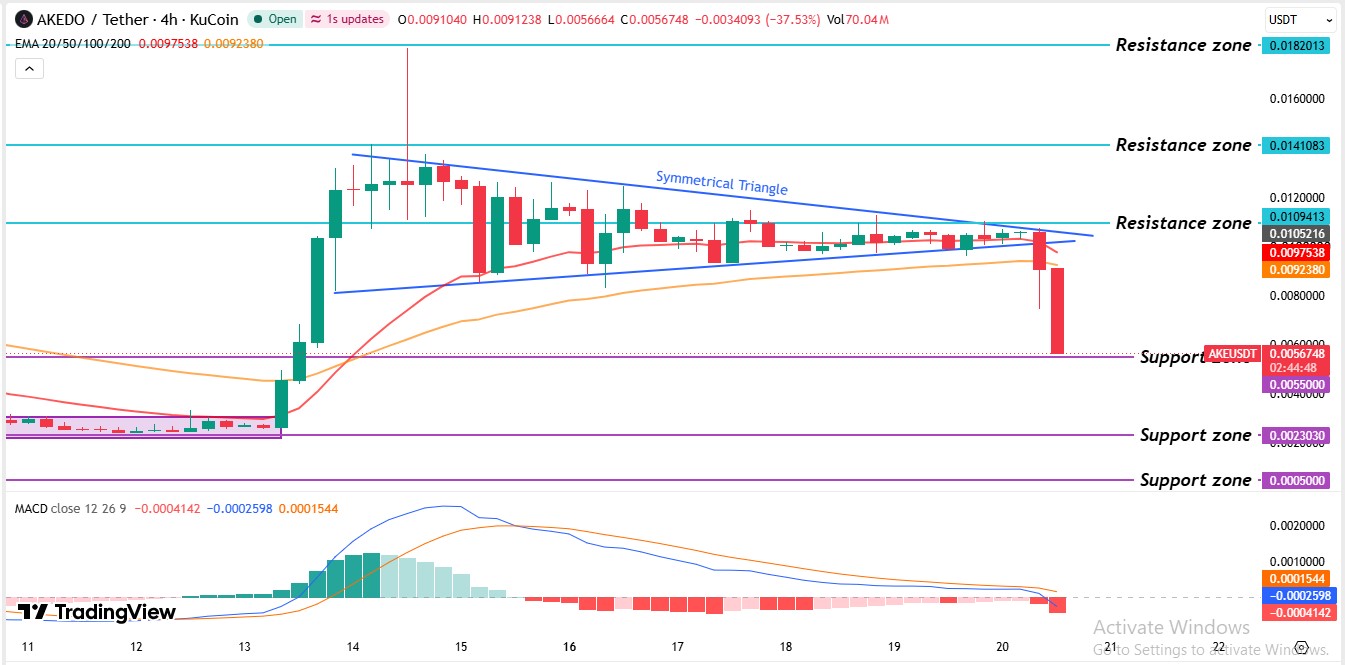
Source: TradingView, AKEDO/USDT 4H chart with 20 EMA, 50 EMA, and MACD, captured Nov 20, 2026, 09:22 UTC
Price then settled into a symmetrical triangle, a pattern of falling highs and rising lows. Buyers tried several times to clear the $0.0109 resistance level and failed. Then the price broke below the triangle and fell through both exponential moving averages toward $0.0055.
The 20 EMA reads $0.009754, about 80.4% above the current price. It reacts faster than the 50 EMA at $0.009238, which sits 70.9% above. Price trades below both, and both are tilting lower. A candle above the 20 EMA would be the first repair.
A symmetrical triangle breaks lower points to more selling. Traders may ask whether this is ashort squeeze or fakeout setup. Only a daily candle above $0.0055 would settle it. Right now, the price trades just under the $0.0055 support level and well below both EMAs and the $0.0109 resistance level.
The MACD line reads -0.0002598 against a signal line at 0.0001544. MACD is a momentum gauge. The line now sits below zero and the signal line, and the histogram reads -0.0004142, so sellers hold the edge.
Support and Resistance Levels
Level
Type
$0.0182
Resistance
$0.0141
Resistance
$0.0109
Resistance
$0.009753
20 EMA
$0.009238
50 EMA
$0.0055
Support
$0.0023
Support
$0.0005
Support
AKE Price Forecast: Bull, Base, and Bear Scenarios
Bull: A daily candle above $0.0109, targeting $0.0141 and then $0.0182. A daily candle back below $0.0109 cancels it, and spot volume would need to rise.
Base: Price stays between $0.0055 and $0.0109 on thin volume and targeting range trade and A daily candle breaking either level ends it.
Bear: A daily candle trading below $0.0055 targets $0.0023. A daily candle back above $0.0055 cancels it.
Risks to this AKEDO price prediction start with the scheduled release, which could add supply to thin trading. Whale transfers could do the same.
What Is the Expert Outlook for AKE After the Drop?
According to CoinGabbar analysis, price trades under both EMAs and MACD sit below their signal lines. This AKEDO price prediction stays bearish while daily candles trade below $0.0055. A daily candle back above that level would show buyers absorbing the vesting release.
Disclaimer: This article is for information only and isn't financial advice. Traders should do their own research and risk only what they can afford to lose.