ALGO is up about 3.2% today and trading above a channel it already broke. Buyers hold the chart for now, but a ceiling sits close near $0.1404. That level decides what comes next. Algorand Pr
ALGO is up about 3.2% today and trading above a channel it already broke. Buyers hold the chart for now, but a ceiling sits close near $0.1404. That level decides what comes next.
Algorand Price Prediction: What Is Happening Now?
This Algorand price prediction starts with a simple setup. ALGO is up about 3.2% today and trading above a channel it already broke.
Bulls hold the chart for now. But a ceiling sits close, near $0.1404. October 2, 2026, [09:22 AM] UTC.
Algorand price today reads $0.1311 on CoinMarketCap, up roughly 3.2% in 24 hours. The day's range ran from $0.1219 to $0.1329.
Binance's ALGO/USDT pair trades near $0.1318, a hair higher, since exchange quotes always drift a little.
Trading Volume and Market Cap
24H volume jumped 59.5% to $201.29M. Market cap sits at $1.18B, up 3.29%.
Volume to market cap runs 16.89%, which means about one-sixth of the entire market cap changed hands in a day.
And that's the part worth respecting. Rising volume gives a move weight.
Circulating Supply and FDV
Circulating supply is 9.06B ALGO, against a 10B total and max supply. Only about 0.94B coins remain unreleased.
FDV is $1.31B. That's close to the current market cap, so dilution risk seems small.
Why Is ALGO Moving Today?
The Algorand Foundation posted about a new Pera Wallet website roughly 16 hours ago.
On September 30, it also issued a final call for the Algorand Global x402 Challenge, a project competition with $100K plus 500K ALGO in prizes.
Neither item is a confirmed price trigger. Bitcoin is up 3.07% at $86,202.30.
But BTC volume fell 3.99% while ALGO volume jumped 59.5%. That gap is the real clue, and more ecosystem stories sit in thecrypto news feed.
Algorand Technical Analysis
Algorand technical analysis here uses the Binance ALGOUSDT 4-hour chart on TradingView, with default indicator settings. Every reading below comes from that timeframe.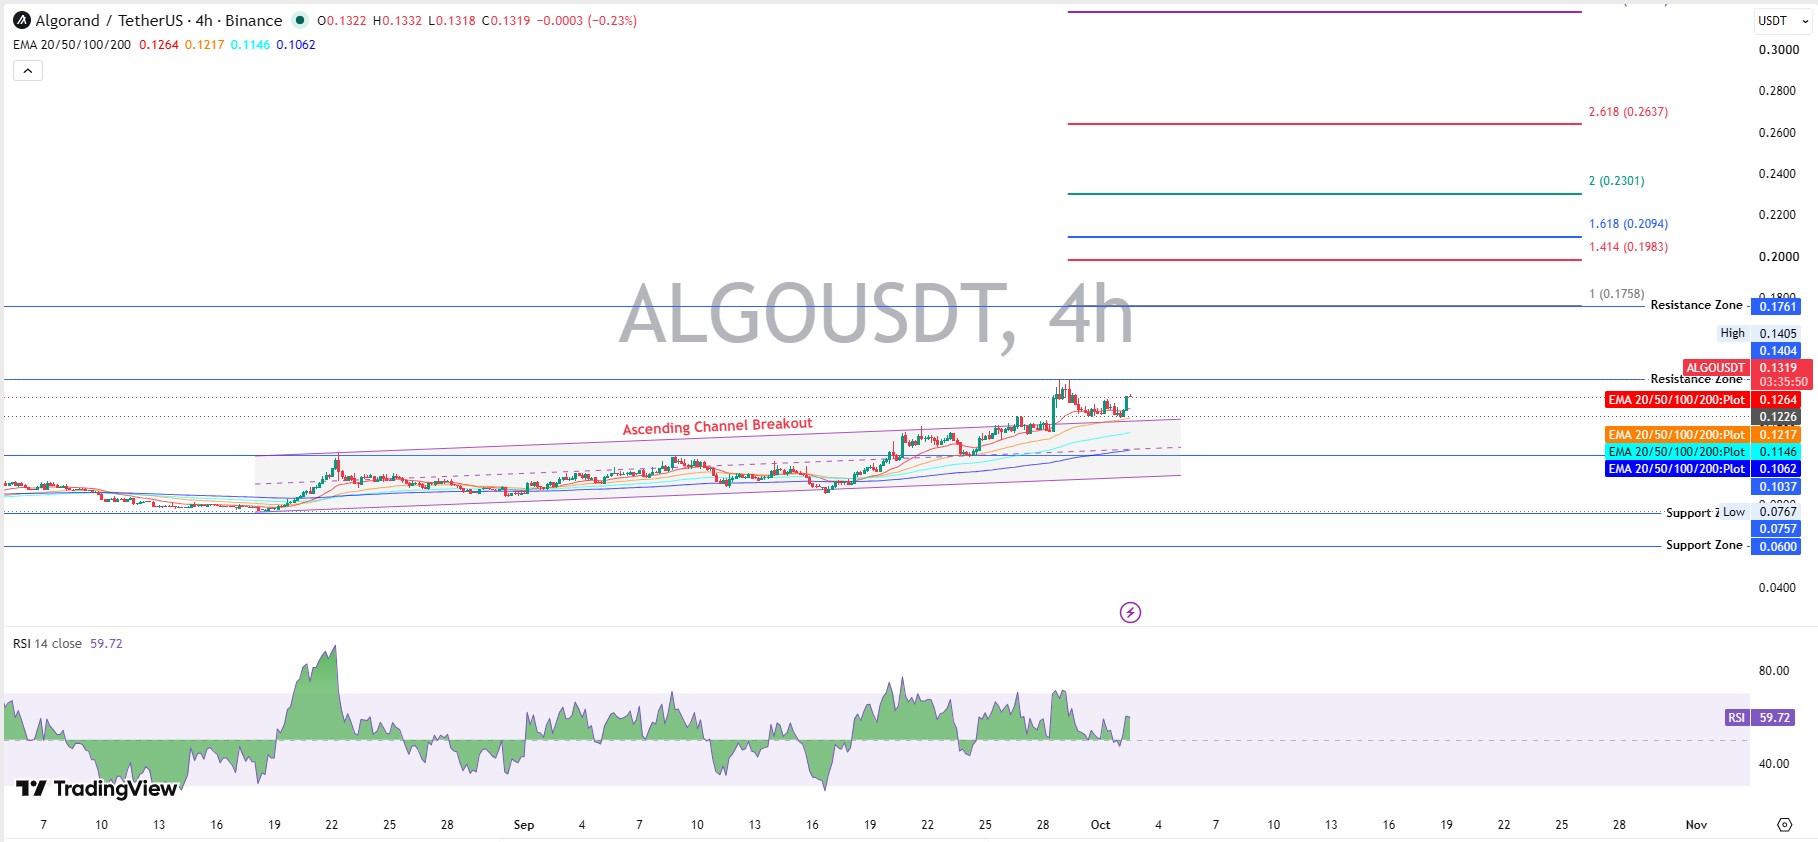
RSI, MACD, EMA, and Bollinger Bands
RSI reads 59.72. Above 50 leans bullish, and below 70 means nothing's overheated yet.
Buyers still have room.
MACD shows 0.0016 on both the MACD and signal lines. The histogram sits at 0.0001.
Translation: a bullish crossover is trying to form. But it's barely there, so it stays a weak signal until the histogram grows.
EMA sits at $0.1264 for the 20, $0.1217 for the 50, $0.1146 for the 100, and $0.1062 for the 200.
Price near $0.1318 trades above all four. That's a clean bullish stack, with the 20 EMA as the first dynamic floor.
Bollinger Bands show $0.1328 upper, $0.1267 basis, and $0.1206 lower.
Price hugging the upper band shows strength. But it often invites a pullback toward the basis.
Key Support Levels
The $ALGO support and resistance map starts below with $0.1226, then $0.1153 and $0.1037. Deeper floors sit at $0.0847, $0.0757, and $0.0600.
CoinMarketCap also lists an all-time low of $0.07577 on July 30, 2026.
Key Resistance Levels
First wall: $0.1404, where the recent high of $0.1405 printed. Next comes the $0.1761 zone, matching the Fibonacci 1 level at $0.1758.
Fibonacci extensions (projected levels drawn from a prior swing) mark $0.1983, $0.2094, $0.2301, and $0.2637 beyond that.
Can $ALGO Rally Continue?
Stance: cautiously bullish. The channel breakout, stacked EMAs, and a healthy RSI all favor buyers.
But MACD is flat. And the price is pressing the upper band.
So can buyers really clear $0.1404?
A prior piece asked whetherALGO could reclaim $0.12, and another weighed abreakout or bull trap.
Call it bullish. Actually, scratch that. Bullish with a short leash fits better.
Algorand Long-Term Price Outlook
For Algorand price prediction 2026 year-end, the chart's far Fibonacci band is $0.2094 to $0.2301. Nothing confirms it yet.
Can $ALGO reach $0.20? It'd need roughly 52% from $0.1311, plus clean breaks of $0.1404 and $0.1761.
The all-time high is $3.28 from June 21, 2019, and the price sits 95.99% below it.
Algorand Price Prediction for October 2026
Algorand price prediction October 2026 hinges on one gate, $0.1404. Scenarios, not promises, follow.
Bull Case
If ALGO breaks and holds above $0.1404 on strong volume, the ALGO price target zones are $0.1761, then $0.1983. Invalidation: trading back under $0.1226. Key risk: a fake breakout.
Base Case
A range between $0.1226 and $0.1404 could play out while MACD stays flat. Condition: volume cools. Invalidation: a decisive move out of either side.
Bear Case
Losing $0.1226 could open $0.1153, then $0.1037. Condition: fading volume and a weak market. Invalidation: a quick reclaim of $0.1264.
Algorand Long-Term Price Outlook
For Algorand price prediction 2026 year-end, the chart's far Fibonacci band is $0.2094 to $0.2301. Nothing confirms it yet.
Can $ALGO reach $0.20? It'd need roughly 52% from $0.1311, plus clean breaks of $0.1404 and $0.1761.
The all-time high is $3.28 from June 21, 2019, and the price sits 95.99% below it.
Key Levels to Watch
Breakout Confirmation
Sustained trading above $0.1404, rising volume, and a widening MACD histogram. All three together carry weight.
Breakdown Risk
Losing the 20 EMA at $0.1264 warns first. Trading under $0.1226 confirms weakness.
Risks That Could Change the Algorand Price Prediction
A flat MACD, fading volume, and a stacked resistance zone are the main chart risks. And BTC weakness could drag altcoins lower fast.
Watchexchange listing news and thecoin events calendar for catalysts. Ecosystem posts alone don't guarantee a rally.
Final Takeaway
ALGO has momentum, structure, and volume. What it lacks is a confirmed break of $0.1404.
Until then, patience beats prediction. More forecasts live in theprice prediction hub.
Disclaimer: This article is for information only and isn't financial advice. Crypto prices are volatile, scenarios aren't guarantees, and readers should research independently before trading.