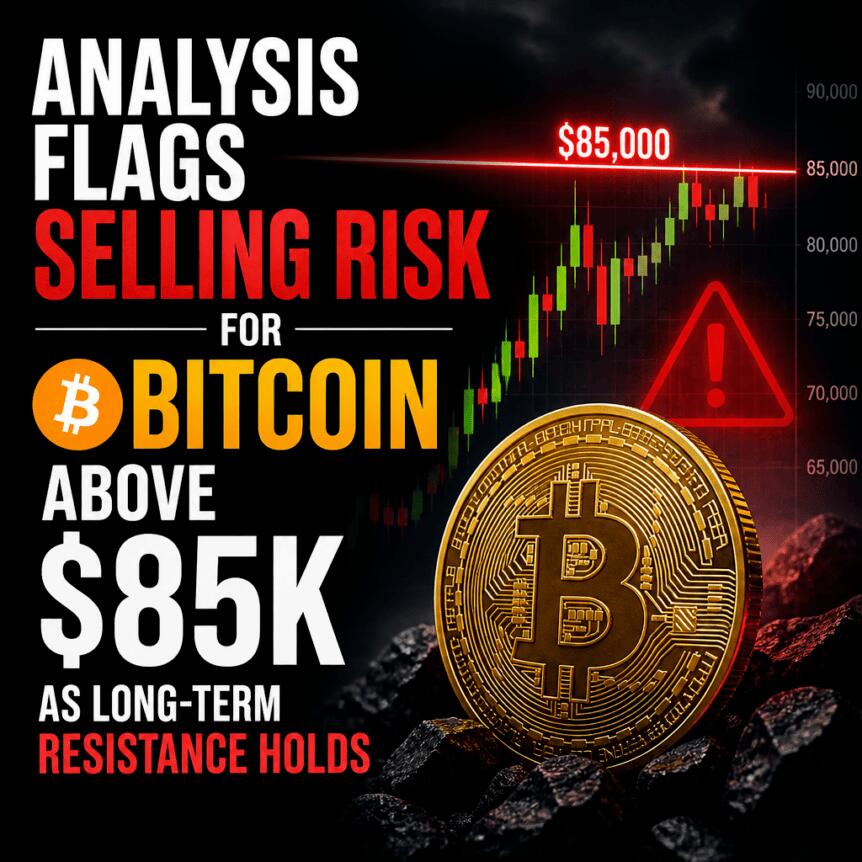
Bitcoin is running into renewed resistance in the mid-$80,000s, with onchain analytics pointing to a concentration of coins whose last move clustered around a key price band. Glassnode’s late
Bitcoin is running into renewed resistance in the mid-$80,000s, with onchain analytics pointing to a concentration of coins whose last move clustered around a key price band. Glassnode’s latest “The Week Onchain” highlights $85,000 as a level where supply tied to prior transactions has repeatedly acted as both a ceiling and a floor.
The implication for traders is straightforward: for sustained upside, BTC may need to turn that supply-based barrier into support. For longer-term investors, the same zone also matters because it aligns with cost basis estimates for a large long-term holder cohort.
Key takeaways
- Glassnode identifies resistance near $85,000, where 864,520 BTC (4.3%) last moved onchain.
- Onchain evidence suggests Bitcoin has respected the $84,000–$85,000 range as support and resistance over roughly the past 11 months.
- Glassnode links the supply at this level to activity that appears dominated by a large holder moving funds across multiple wallets.
- Long-term holders appear positioned with a combined cost basis between $85,000 and $118,000, raising potential sell-side pressure if price revisits $85,000.
- The long-term holders’ SOPR is reported at 0.99, indicating aggregate movement near break-even to mild loss.
Glassnode flags $85K as a recurring supply barrier
In its weekly onchain report, Glassnode points to the $84,000–$85,000 zone as an area where market participants have repeatedly anchored their trading behavior. According to Glassnode, a meaningful slice of the total BTC supply last moved on Nov. 22, 2025, when BTC/USD traded between $84,000 and $85,000.
Those coins represent 4.3% of circulating BTC—equivalent to 864,520 BTC—and Glassnode attributes the cluster largely to the behavior of a single large holder distributing bitcoin across multiple wallets. While self-transfers typically don’t carry direct price implications, the analysis emphasizes that Bitcoin has continued to react around this band as if it remains economically significant to the broader holder base.
Glassnode notes the range worked as support in December, with price bouncing off the level on December 1 and December 18. The band later weakened on January 31, when an attempt to push back toward $84,000 failed—followed by a drop of roughly 20% over the subsequent days.
More recently, the report describes repeated upside stalls near the same area. It says BTC’s recovery momentum faded in May, September, and October, with a peak of $87,400 that still fell short of converting the mid-$80,000 band into persistent support. Glassnode also claims there have been only five daily closes above $85,000, and never more than three in a row.
That pattern matters because it suggests the level isn’t just an intraday obstacle—it is tied to how supply behaves when price reaches it. As Glassnode puts it, a run of daily closes above $85,000 would be the condition most likely to “turn the band back into support.”
Long-term holder cost bases overlap the resistance zone
The $85,000 area doesn’t only reflect short-term trading memory. Glassnode also frames it in terms of long-term holder (LTH) positioning—entities that have held their bitcoin without selling for at least 155 days.
Per Glassnode, long-term holders collectively own around 4 million BTC that last moved onchain between $85,000 and $118,000, with much of the activity occurring mostly in 2025. The analytics platform argues that this group is economically vulnerable if price returns to the lower end of that band.
Glassnode highlights that more than half of those long-term holdings were acquired at prices above today’s level. In a scenario where BTC recovers toward $85,000, Glassnode suggests that “many of these holders may sell to get their money back.”
That observation is important for interpreting resistance not simply as a charting phenomenon, but as a potential consequence of realized or expected profit-taking behavior among investors with relatively high cost bases. Even if the earlier onchain cluster points to a specific holder and transaction set, the LTH overlay indicates the level could be challenged by broader supply economics.
SOPR near 1 suggests limited relief for long-term holders
Glassnode supplements its resistance analysis with a profitability gauge for long-term holders: the spent output profit ratio (SOPR). SOPR compares whether LTH coins that move onchain are being spent at a higher or lower price than their previous transaction.
In the latest report, Glassnode states that LTH SOPR currently sits at 0.99. Since SOPR readings below 1 imply that the aggregate cohort is moving coins at a loss, the metric points to LTH activity being close to break-even, but not clearly in profit.
For market participants, that nuance matters because it speaks to whether long-term holders are already distributing supply in a way that would typically intensify sell pressure. A SOPR at 0.99 suggests the selling (or coin movement) behavior isn’t decisively “in profit” yet—potentially limiting how aggressive profit-taking might be, but also indicating that a meaningful portion of long-term holders may still be waiting for price to improve before fully exiting.
What to watch next: confirmation above $85K
The near-term question is whether BTC can generate enough sustained closes to dismantle a supply-linked ceiling. Glassnode’s own framework emphasizes daily close behavior: the transition from resistance to support is most likely if BTC sustains trading above $85,000 rather than repeatedly rejecting it. Until that happens, both the clustered onchain supply and the long-term holder cost basis in the same region remain key factors shaping upside attempts.
This article was originally published as Analysis flags selling risk for Bitcoin above $85K as long-term resistance holds on Crypto Breaking News – your trusted source for crypto news, Bitcoin news, and blockchain updates.