Analyst identifies $0.045-$0.035 as a major accumulation zone and $0.08 as the key reclaim level. Patel projects bull-cycle targets of $0.157, $0.35, $0.70, $1.146 and $2 after a confirmed ma
- Analyst identifies $0.045-$0.035 as a major accumulation zone and $0.08 as the key reclaim level.
- Patel projects bull-cycle targets of $0.157, $0.35, $0.70, $1.146 and $2 after a confirmed macro breakout.
- SEI trades above its 50-day and 200-day moving averages, with $0.048 support and $0.053-$0.055 resistance in focus.
SEI trades near $0.050 after rebounding from its July and early August lows. Crypto Patel outlined a potential 4,000% rally from the current structure. Patel pointed to a multi-year descending channel, a major demand zone, and $0.08 as a key reclaim level, while chart data shows SEI above both major moving averages.
SEI Recovers From Major Demand Zone
Crypto Patel said SEI remains within a multi-year descending channel and has reached its lower boundary. He identified $0.045–$0.035 as the higher-timeframe accumulation zone. According to Patel, SEI is already 35% above that accumulation area.
He also identified about $0.08 as major historical support and resistance. The analyst said a higher low followed by a channel breakout could precede a new macro expansion. His outlined sequence runs from accumulation to a higher low, channel breakout, $0.08 reclaim, retest and continuation.
However, Patel placed weekly invalidation below $0.034. He also listed bull-cycle targets at $0.157, $0.35, $0.70, $1.146 and $2.
Price Clears Key Moving Averages
Chart data shows SEI near $0.050 after a prolonged decline. Price fell from above $0.065 to about $0.052 between March and early April. It later recovered toward $0.063 in late April. A strong move in early May pushed SEI to roughly $0.077 before a sharp reversal followed.
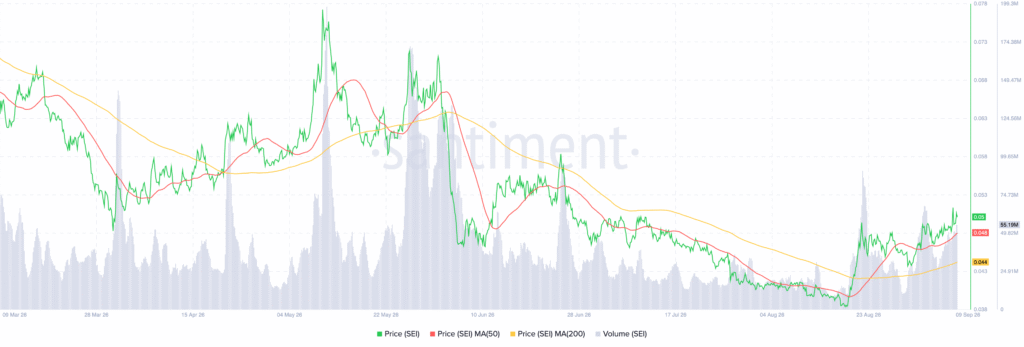
Source: Santiment
SEI then dropped below $0.045 in June. The decline continued through July and early August, when price reached approximately $0.039–$0.040. Since then, SEI has recovered above the 50-day moving average at $0.048. The 200-day moving average sits around $0.044, leaving price above both levels.
Resistance Levels Shape the Next Move
The 50-day moving average has turned upward, while the 200-day average has flattened after its decline. Recent upward movements also came with higher trading volume. Immediate resistance is around $0.053–$0.055. The next resistance zone sits between $0.058 and $0.063.
On the downside, $0.048 provides the first support, followed by $0.044 and $0.040. A sustained move above $0.055 could target $0.063. However, losing $0.048 could expose the $0.044–$0.040 region. Patel's longer-term structure also keeps $0.08 and $0.034 as major levels.