Analyst Rejects BNB $20K Target With Market Cap Math
Analyst says a $10,000–$20,000 BNB price would require a $1–$2 trillion valuation, making such targets unlikely. Despite strong network activity, including rising stablecoin supply and transa
A
AnonymousCryptoCompass newsroom
June 7, 2026
3 min read
NEWS
CryptoCompass editorial visual for markets coverage.
Analyst says a $10,000–$20,000 BNB price would require a $1–$2 trillion valuation, making such targets unlikely.
Despite strong network activity, including rising stablecoin supply and transaction volume, BNB remains below key technical levels.
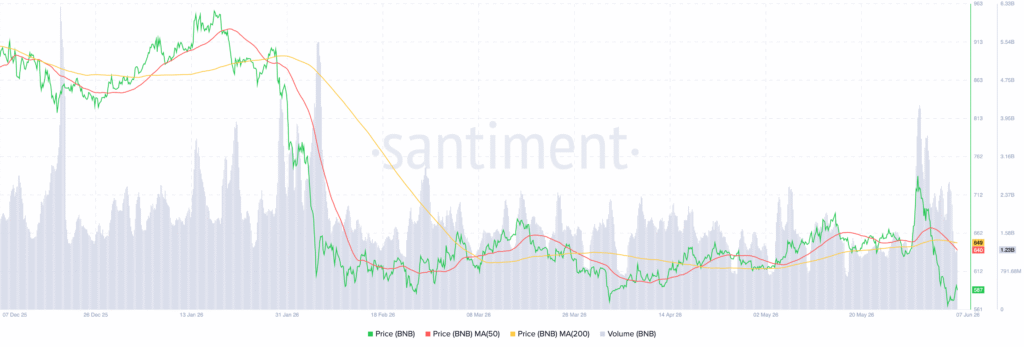
BNB trades under its 50-day and 200-day moving averages, with resistance near $640–$650 and support around $580–$560.
Crypto analyst Crypto Patel stated that BNB cannot realistically reach $10,000 to $20,000 under current market conditions. He made the comments while analyzing BNB’s price near $570 and a $77 billion market cap. Patel said such targets would require market valuations close to or above the entire crypto sector. He also referenced trading data showing BNB remains below key moving averages.
Market Cap Math Challenges High Price Targets
Crypto Patel stated BNB trades near $570 with a market cap around $77 billion. He noted the asset previously hit about $1,375 in October 2025. That peak remains the highest level recorded in the recent cycle.
He added that a $10,000 BNB would require roughly a $1 trillion valuation. A $20,000 price would push valuation close to $2 trillion. Patel compared this figure to the total crypto market, which sits near $2.2 trillion.
He also highlighted network activity data. BNB recorded over 31 million daily transactions during 2025. Stablecoin supply on the chain doubled to $14 billion. Real-world asset value crossed $1.8 billion, with participation from major asset managers.
Bearish Structure Follows January Breakdown
The price structure shifted after BNB traded near $950 in January. A sharp decline followed, pushing the asset below $650 within weeks. Volume increased heavily during the drop, reflecting strong selling pressure.
The 50-day moving average crossed below the 200-day moving average during this phase. Since then, price has moved mostly between $600 and $680. A later rejection near $730 led to another drop toward $570.
Key Levels Remain Below Moving Averages
Current data shows BNB trading under both major moving averages. The 50-day level sits near $640, while the 200-day level stands near $649. Price remains below both indicators at roughly $570.
Source: Santiment
Support is located near $580, followed by $560. Resistance remains between $640 and $650. A move above this zone could target $700 to $730. Failure to reclaim it keeps the broader structure under pressure.
Key Takeaways Exchange reserves hit their lowest dataset reading as withdrawals accelerate. This is the third test of $1,600 support since 2023. TD Sequential 9-count printed directly inside
Strategy CEO Phong Le has doubled down on the company’s Bitcoin-first strategy after Michael Saylor’s latest buy signal revived expectations that the world’s largest corporate BTC holder coul
Bitcoin has been under pressure, and Bloomberg’s senior macro strategist, Mike McGlone, thinks the worst hasn’t even arrived yet. According to his latest forecast, the price of BTC will drop


 Source: Santiment