XLM fell to $0.197, trading below its 50-day moving average at $0.209 and 200-day average at $0.202. Egrag Crypto identifies $0.24 as XLM’s breakout trigger, while 0.16–0.17 remains a potenti
- XLM fell to $0.197, trading below its 50-day moving average at $0.209 and 200-day average at $0.202.
- Egrag Crypto identifies $0.24 as XLM’s breakout trigger, while 0.16–0.17 remains a potential long zone pending reversal confirmation.
- XLM faces immediate support at $0.19, while a confirmed breakout could target $0.31, $0.40, $0.70, $2.15 and $4.20.
Stellar (XLM) has fallen to approximately $0.197 after failing to sustain its September recovery toward $0.24, according to analyst Egrag Crypto. The analyst identified $0.24 as his preferred breakout trigger but said the move lacked confirmation. Meanwhile, XLM has dropped below its 50-day and 200-day moving averages.
XLM Falls Below Both Moving Averages
XLM’s latest decline followed a volatile recovery that began after its price dropped toward $0.14 in May. The token traded around 0.16–0.18 in April before extending its losses into late May.
However, a sharp rally in early June briefly pushed XLM toward $0.295, accompanied by an exceptional increase in trading volume. The advance later faded, sending the price back toward 0.18–0.20.
XLM then weakened toward 0.155–0.16 by mid-August. A rebound beginning around August 18 lifted the token above $0.20, before another advance carried it toward 0.23–0.24 in late September.
Sellers regained control in early October, bringing XLM down to approximately $0.197. The price now sits below its 50-day moving average at $0.209 and its 200-day average at $0.202.
Egrag Identifies0.16–0.17 as Next Long Zone
Egrag Crypto said the two-week chart suggested a possible rejection at the 50-period moving average. The analyst maintained that XLM needed to confirm a breakout above $0.24 before he would consider a long position.
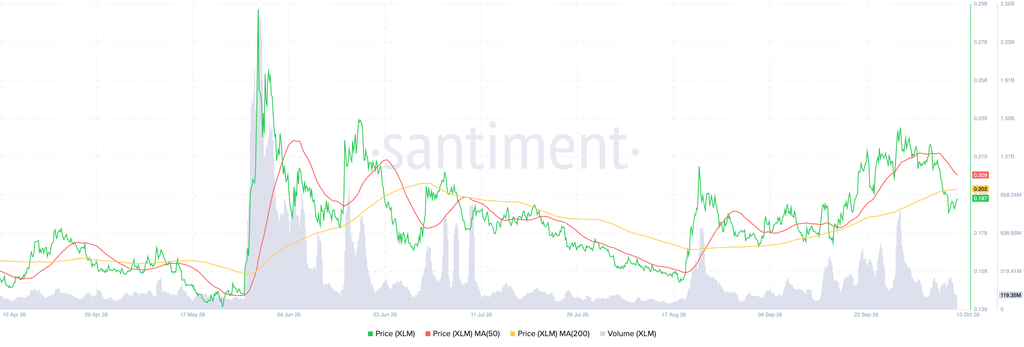
Source: Santiment
Instead, his preferred roadmap includes a possible retest of 0.16–0.17. He identified this range as his next long zone, subject to reversal confirmation.
The current chart places immediate support between $0.19 and $0.197. Below that range, XLM could revisit 0.179–0.18, followed by the deeper 0.159–0.16 region.
XLM Breakout Targets Extend From $0.31 to $4.20
Egrag outlined several upside objectives if XLM eventually breaks above its trigger. The first targets stand at $0.31 and 0.38–0.40, followed by $0.70, $2.15, and $4.20.
However, XLM first needs to reclaim the 0.202–0.209 range to improve its technical position. The 0.22–0.24 zone remains the next resistance area, while $0.19 represents immediate support.