Bitcoin has been one of the most-watched assets in 2026, alongside oil, gold, and stocks. Governments now hold 518,526 BTC, or 2.47% of the total supply, with the U.S. accounting for nearly 0
Bitcoin has been one of the most-watched assets in 2026, alongside oil, gold, and stocks. Governments now hold 518,526 BTC, or 2.47% of the total supply, with the U.S. accounting for nearly 0.94%.
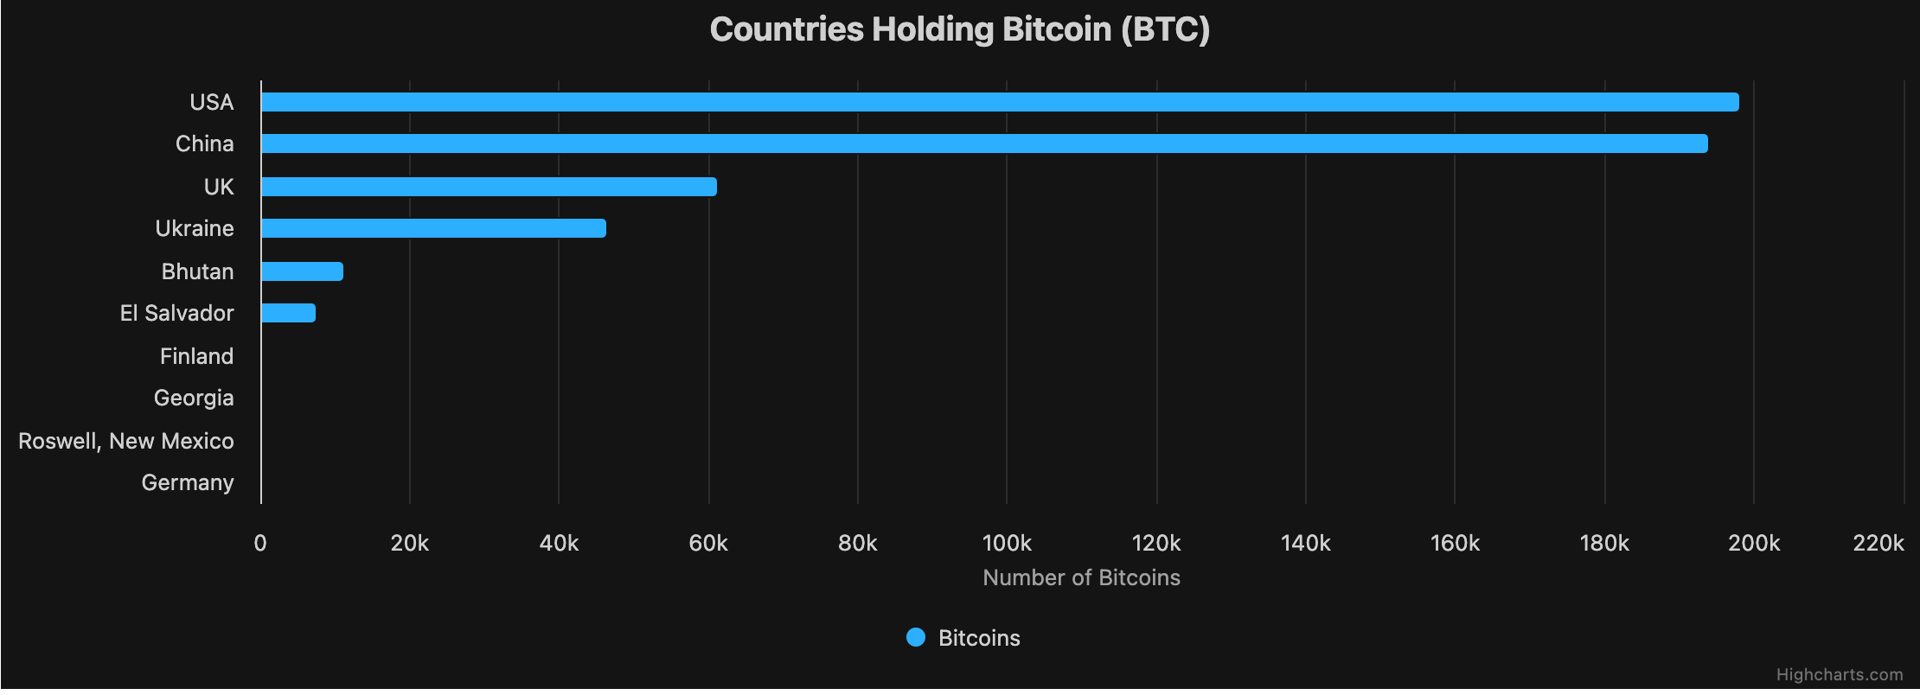
Bitcoin holdings of countries and governments
BitBo
As Bitcoin trades between $60,000 and $65,000, investors are keeping a close eye on institutional buying. Over the past month, Bitcoin holdings of public companies have risen by 3.2%.
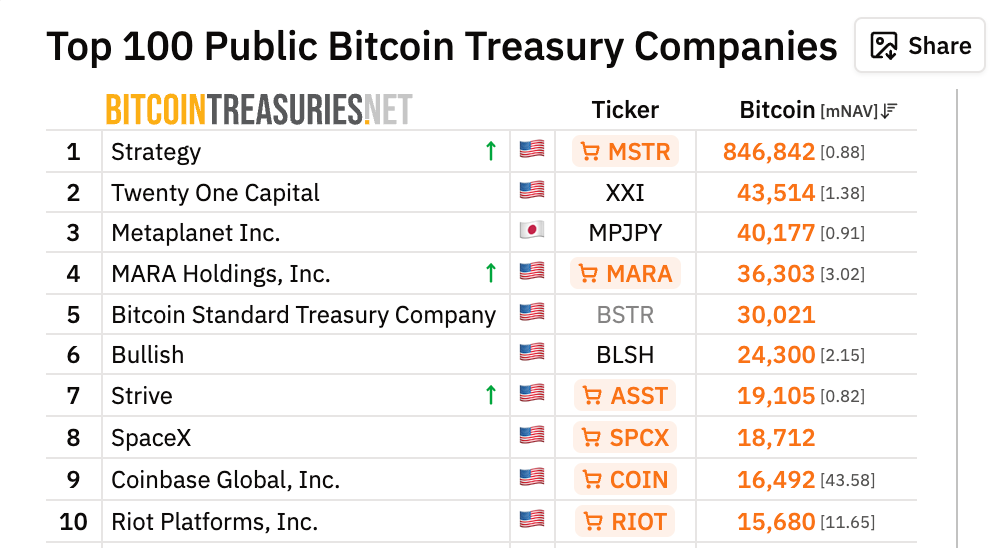
Bitcoin held by publicly listed companies
BitcoinTreasuriesNET
Strategy bought 1,587 BTC between June 8 and June 14, while Metaplanet crossed the 40,000 BTC mark by mid-June.
With companies continuing to accumulate Bitcoin, the big question is: how high could prices go if institutional buying increases?
Related: MicroStrategy Boosts Reign as Biggest Corporate Bitcoin Holder
Bitcoin's Q3 outlook
Bitcoin is trading around $65,660 as of mid-June 2026. After hitting nearly $98,000 back in late 2025, it's been in a prolonged downtrend, a series of lower highs and lower lows, for about six months. That's the descending white line you see on the chart.
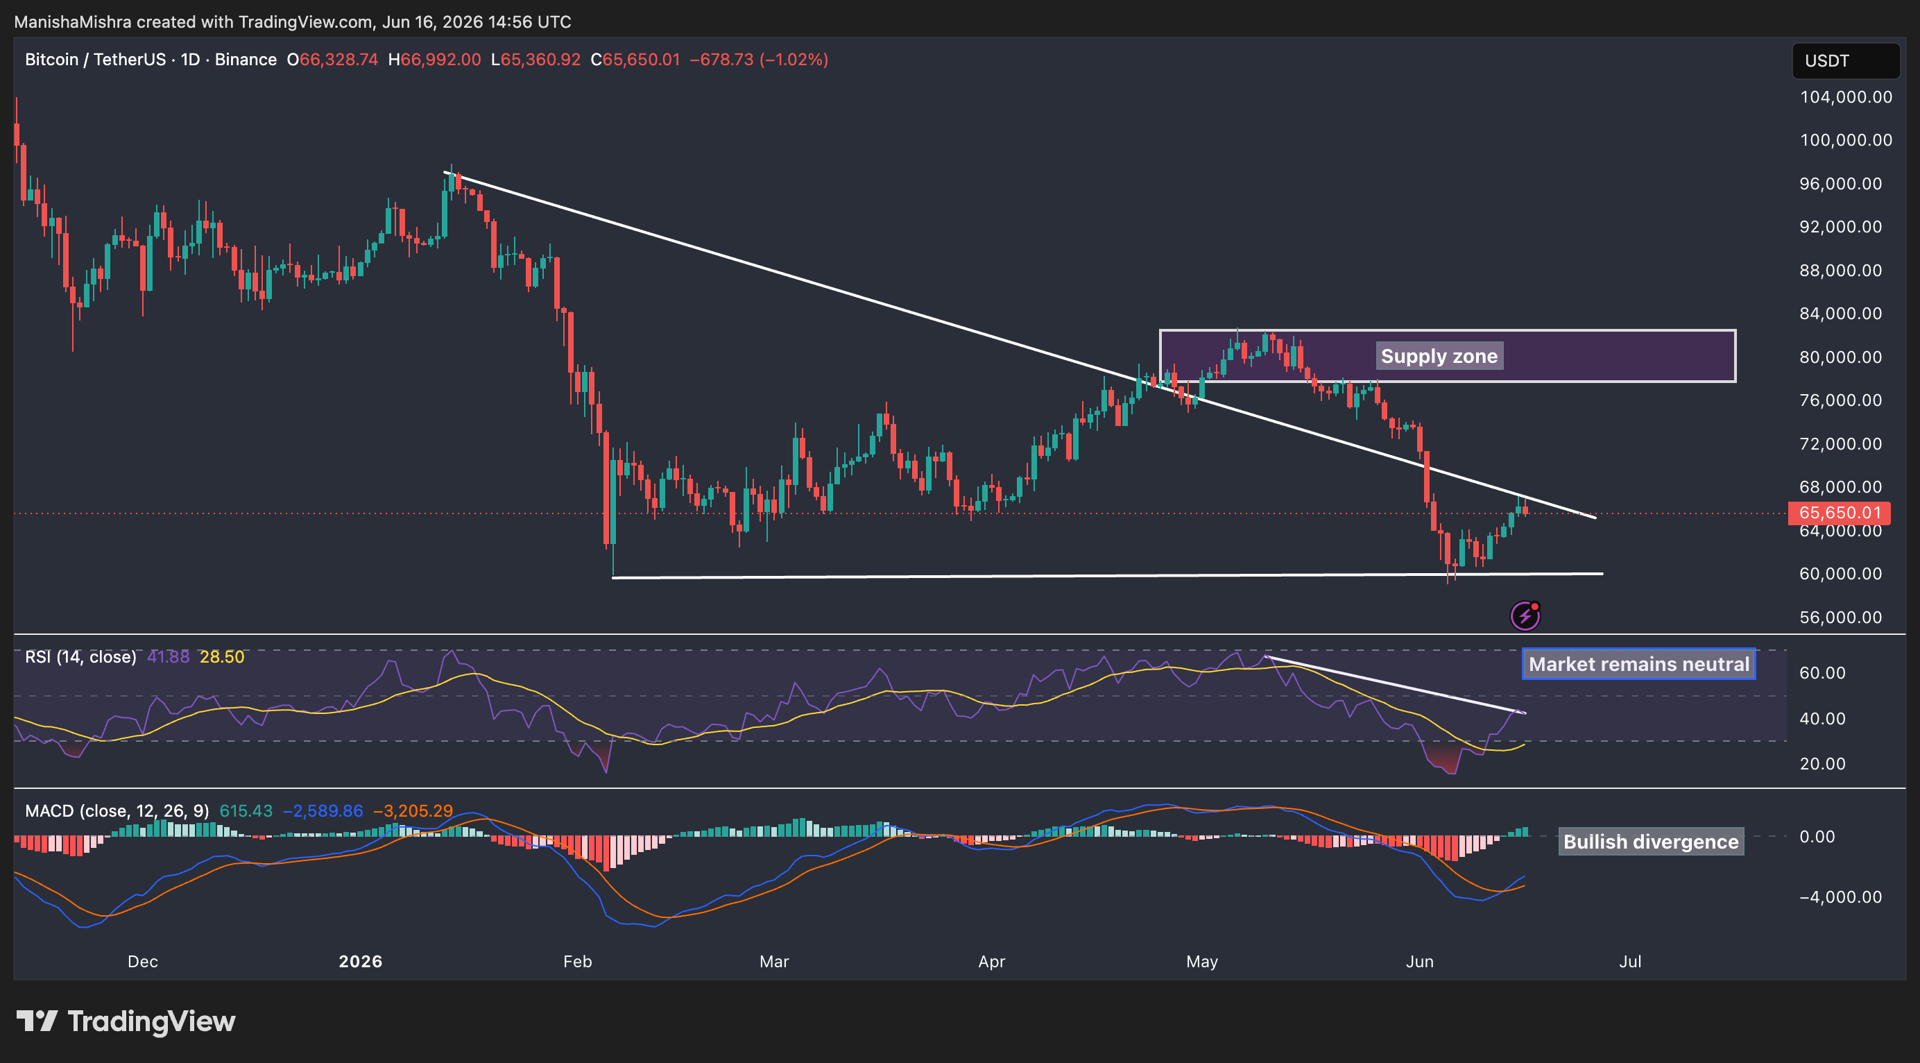
BTC/USDT 1-Day price chart
TradingView
What the chart is telling us?
If we look at Bitcoin's 1-day BTC/USDT chart, we find mixed signals. The market is showing both positive and negative signs.
- Bitcoin is stuck in a downtrend, but may be near a bottom
The falling trendline (in white color) has acted like a ceiling every time Bitcoin tried to recover. Even when it managed to climb back to the $77K-$80K range in May, it got rejected hard from that supply zone (the purple box). That zone is where a lot of sellers are still waiting.
Trending on TheStreet Roundtable:
- MACD is showing bullish divergence, potential early warning sign
Bitcoin's price made a lower low recently, but the MACD (the indicator at the bottom) histogram made a higher low.
This mismatch, called a bullish divergence, often signals that selling momentum is slowing down, even if the price hasn't recovered yet. It's not a guarantee of a rally, but it's reason to watch the markets closely.
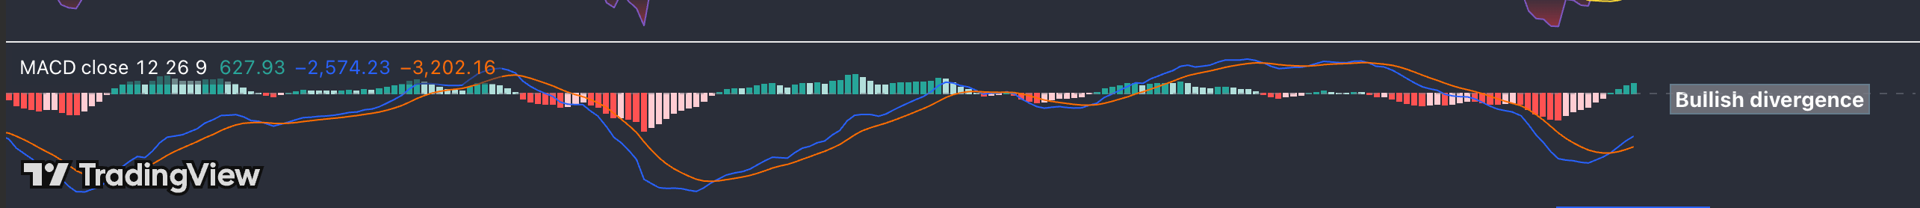
MACD shows a bullish divergence on 1-Day BTC/USDT price chart
TradingView
- RSI says sellers are getting tired, but not done
The RSI (middle indicator) is currently near oversold levels, which means Bitcoin has seen strong selling pressure recently.
In the past, when the RSI fell this low and then started moving higher, prices have often recovered. However, it's still too early to confirm that sellers are losing strength.
RSI hovers over the oversold zone on BTC/USDT 1-Day Chart
So what could happen in July-September 2026?
If Bitcoin can hold above $60K-$61K and the MACD divergence plays out, we could see a gradual climb back toward $72K first (the midpoint of the range), and potentially a retest of the $77K-$80K supply zone by August or September.
Breaking above that supply zone convincingly would be a major bullish signal.
Related: Cathie Wood sells her favorite crypto stock despite surge
However, if Bitcoin falls below the key support zone of $60,000-$61,000, prices could decline further and may quickly move toward the $55,000-$58,000 range. That would likely signal the downtrend is still firmly in control, and Q3 could close red.
It's important to note, Bitcoin is at a decisive point at the moment. The technical setup has early signs of a potential recovery, bullish MACD divergence, oversold RSI, and a tested support floor.
But the trend is still down, and the $77K-$80K supply zone is a heavy ceiling to break.
Related: Anthony Scaramucci unveils Bitcoin target for July
The king coin's performance will largely depend on the global economy and geopolitical developments. However, investors should be prepared for continued market volatility.
Disclaimer: This article is for informational purposes only and does not constitute financial advice. Cryptocurrency investments are highly volatile and risky. Always conduct your own research before making any investment decisions.