Analyst says SUI’s 12-hour TD Sequential has flashed a fresh buy signal as price tests the $0.70-$0.72 support zone. SUI must reclaim $0.75, then $0.78-$0.85, while Michael van de Poppe sees
- Analyst says SUI’s 12-hour TD Sequential has flashed a fresh buy signal as price tests the $0.70-$0.72 support zone.
- SUI must reclaim $0.75, then $0.78-$0.85, while Michael van de Poppe sees a return to $0.85 as key for $1.
- RSI and MACD show early improvement, but losing $0.70 could expose SUI to $0.64 and $0.60.
SUI is trading near $0.72 after retreating from $0.85, while analysts track support around $0.70. Ali Charts reported a fresh buy signal from the TD Sequential indicator. Meanwhile, Michael van de Poppe and Investor Jordan identified different price levels that could shape SUI’s next move.
Analysts Watch SUI’s Support Levels
Ali Charts said the TD Sequential has accurately identified major trend changes on SUI’s 12-hour chart. Its previous signal appeared after a 17% rally and preceded a shift in momentum. The indicator has now flashed another buy signal while SUI trades near $0.71.
However, Michael van de Poppe said SUI needs to hold its current support area after a full retest. He identified $0.85 as an important recovery level. According to van de Poppe, a return toward $0.85 could lead to prices above $1.
https://twitter.com/CryptoMichNL/status/2099224093362958748?s=20
Investor Jordan offered a more cautious view. He said SUI has lost its bullish momentum and returned to daily support near $0.70. Jordan also disclosed that he invested slightly more than $100,000 in SUI.
SUI Price Remains Below Recent Highs
SUI currently trades at $0.7234. The latest candle opened at $0.7167, reached $0.7280, and touched $0.7151. The broader structure remains corrective after SUI rose from roughly $0.65 in late August.
The token reached approximately $0.84–$0.85 in early September before beginning a sustained decline. Price later returned toward the $0.72 region. The immediate trend remains bearish to neutral, although recent candles show attempts to stabilize.
Immediate support stands around $0.715–$0.720, followed by $0.70. A deeper decline could expose $0.68–$0.65. On the upside, SUI must first reclaim $0.75, followed by resistance around $0.78–$0.80 and $0.82–$0.85.
Momentum Indicators Show Early Improvement
The RSI is at 44.45, above its moving average at 35.94. However, it remains below the neutral 50 level. The MACD histogram is positive at 0.0019, while the MACD line is at -0.0135.
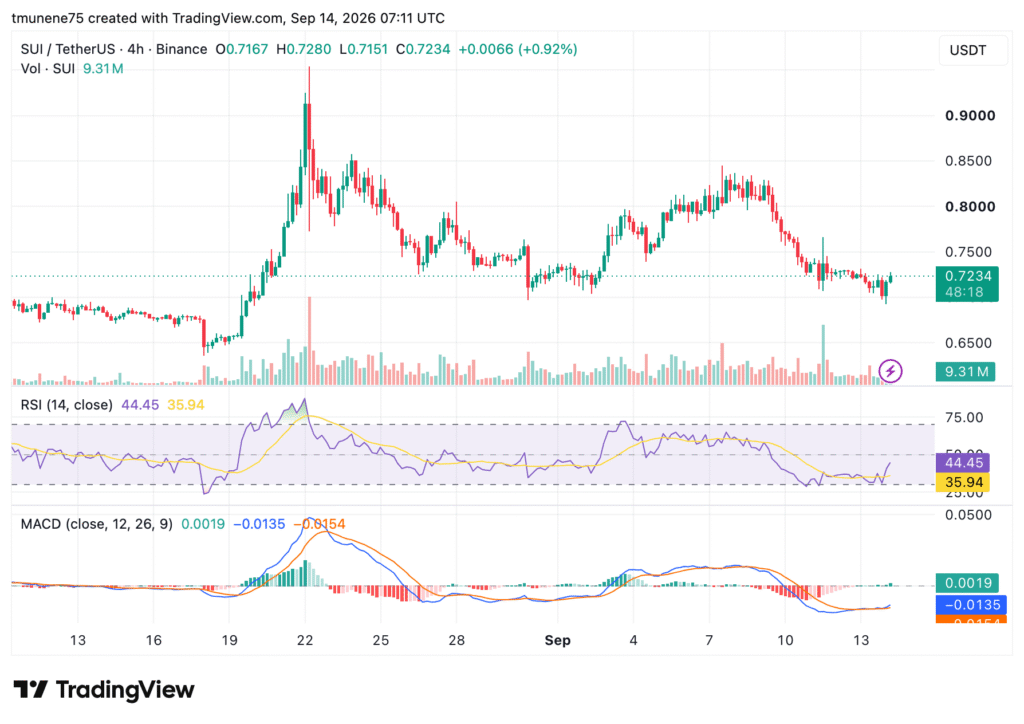
Source:
TradingViewThe MACD line has moved above the signal line near -0.0154. Trading volume is at 9.31 million. Jordan said losing $0.70 could expose SUI to $0.64 and $0.60. He added that he could increase his position if buyers defend the area.