APRZ has recovered 22% from its recent low, broken above Resistance-1, and is now pointing directly at the all-time high zone. On paper, this is exactly what a recovery looks like. But the vo
APRZ has recovered 22% from its recent low, broken above Resistance-1, and is now pointing directly at the all-time high zone.
On paper, this is exactly what a recovery looks like. But the volume behind this move is under $1; two buyers drove the entire 24-hour session, and one wallet still controls 85.47% of the supply.
So is this a genuine ApeMars price prediction breakout building toward a new ATH, or is the chart simply moving because nobody is selling rather than because anyone is actually buying?
ApeMars Whale Concentration: The Risk That Never Goes Away
With a total market cap of just $325K and one wallet holding 85.47% of all APRZ supply at a value of $277.7K, the concentration risk here is not a footnote; it is the entire risk framework.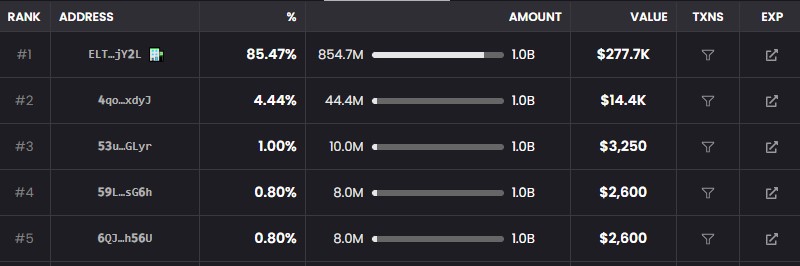
Source:Info by DexScreener
That single wallet effectively owns most of what the market cap represents.
The remaining 46 holders collectively control less than 15%, meaning genuine price discovery from distributed buying is structurally limited until that dominant position either reduces or remains consistently inactive.
For any Ape-Mars price prediction scenario to hold, the whale wallet's behavior is a more important variable than any resistance level on the chart.
What Is ApeMars Building? Ecosystem and Listing Price Gap
The official ApeMars site positions the project as "The Official Crypto Mission to Mars," a narrative-driven meme coin built across 23 presale stages and 225 million symbolic kilometers under the Ape Space Administration.
Source: ApeMars official website
The claim live status is active, thelisting price sits at $0.0005, and the presale has fully concluded.
With APRZ currently at $0.0003250, the token is approximately 35% below its own official listing price.
Every resistance level cleared closes that gap slightly, making the listing price itself a meaningful long-term psychological target for existing holders watching the recovery develop.
APRZ Market Snapshot: Price, Volume, and Liquidity
APRZ is currently trading at $0.0003250 on Orca (Solana), up 1.16% over the past 24 hours, with liquidity at $277K and both market cap and FDV at $325K.
Volume sits at under $1 with just 2 transactions, 2 buyers, and 0 sellers recorded. The EMA-20 on the 4-hour chart sits at $0.0003511, still above the current price, meaning the short-term moving average has not yet confirmed the recovery as a trend flip despite the recent bounce.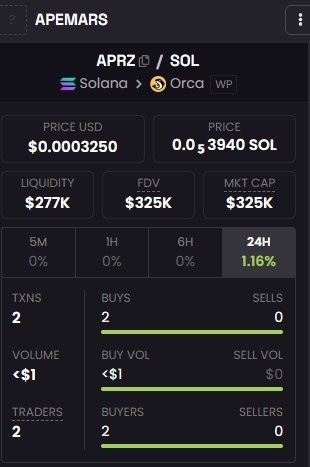
Source: Info by DexScreener
Metric
Current Data
Price
$0.0003250
24H Change
+1.16%
Liquidity
$277K
Market Cap / FDV
$325K
Volume
<$1
Transactions
2 (2 Buys, 0 Sells)
EMA-20 (4H)
$0.0003511
ApeMars Technical Analysis: Resistance-1 Cleared, ATH Zone in Sight
The 4-hour chart shows APRZ has cleared Resistance-1 near $0.0003082 and is now trading at $0.0003250, with the EMA-20 at $0.0003511 sitting just above as the first dynamic resistance to overcome.
Resistance-2 near $0.0003400 is the next horizontal target, and above that, Resistance-3 near $0.0003880 marks the all-time high zone.
A confirmed 4-hour close above the EMA-20 would be the most important technical confirmation the recovery has produced so far.
Invalidation sits at a close back below $0.0003082, which would flip the structure bearish and return Support-1 near $0.0002650 as the next downside focus. 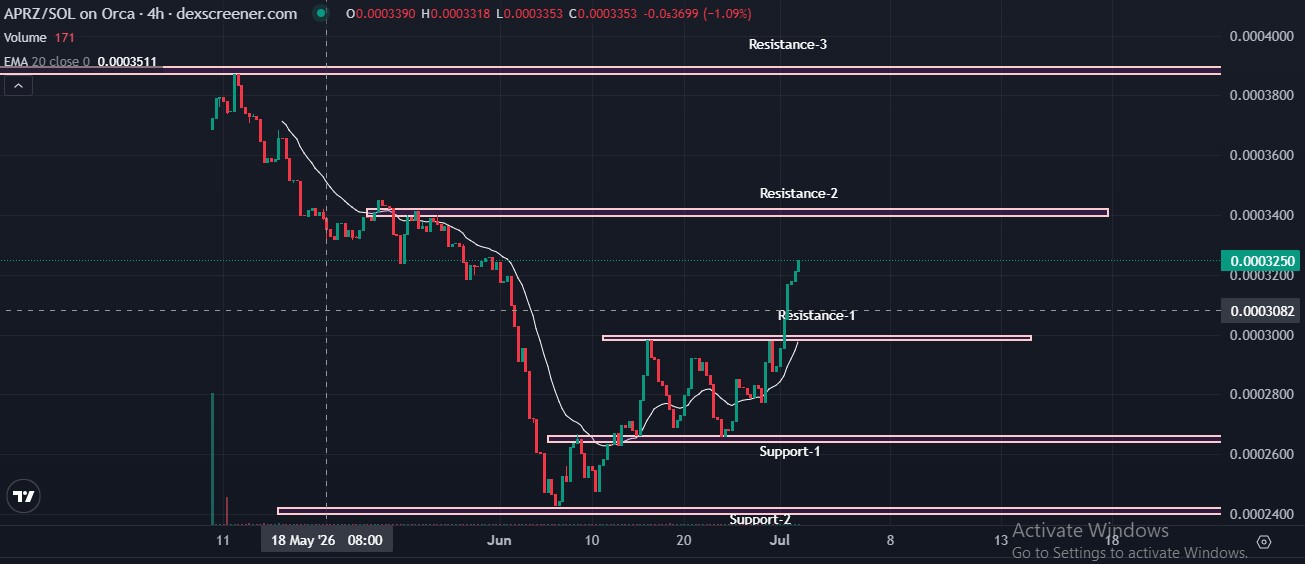
Source: Chart by DexScreener
Level
Price
Status
Resistance-3 / ATH Zone
~$0.0003880
Major target, previous high zone
EMA-20 (4H)
$0.0003511
Dynamic resistance above price
Resistance-2
~$0.0003400
Next immediate target
Current Price
$0.0003250
Above R1, approaching R2
Resistance-1
~$0.0003082
Broken — now key support
Support-1
~$0.0002650
First downside floor
Support-2
~$0.0002400
Deeper base level
ApeMars Price Prediction: Can APRZ Reach a New All-Time High?
For ApeMars price prediction scenarios, the path to a new all-time high requires clearing three sequential hurdles: EMA-20 at $0.0003511, Resistance-2 near $0.0003400, and Resistance-3 near $0.0003880.
Each step requires more than just the price touching the level; it requires a sustained close above it with enough volume to prevent an immediate reversal.
At current volume levels, the ApeMars price prediction bull case depends almost entirely on new buyers entering the market in meaningful size, since existing activity from two traders per day cannot sustain a multi-resistance rally on its own.
However, if volume does expand alongside the recovery, the ApeMars Price Prediction ATH target near $0.0003880 becomes a structurally achievable objective.
Scenario
Condition
APRZ Price Target
Invalidation
Close below $0.0003082
Retest $0.0002650 – $0.0002400
Base Recovery
R2 cleared; volume improves moderately
$0.0003400 – $0.0003511 (EMA zone)
Bull Case
EMA + R2 cleared on volume; whale inactive
$0.0003880 ATH zone
ATH Break
Volume surge, new buyers enter, R3 cleared
New price discovery above $0.0003880
Expert View: What ApeMars Price Prediction Analysts Are Watching
Coingabbar analysts tracking ApeMars price predictions note that the 22% recovery from recent lows is technically meaningful, but the volume behind it remains the critical missing piece.
The APRZ chart structure is the most bullish it has been since the initial decline began, with Resistance-1 cleared and both Resistance-2 and the EMA-20 within reach.
For the ApeMars Price Prediction ATH scenario to become credible, volume needs to expand significantly over the next several sessions.
A daily volume figure consistently above $500 to $1,000 would represent a meaningful shift from current levels and would give the Resistance-2 and Resistance-3 targets real backing.
Until then, every resistance test should be treated as a potential reversal point rather than a confirmed continuation signal.
Disclaimer
This article is for informational purposes only and does not constitute financial advice. Cryptocurrency investments carry significant risk, including total loss of capital. Always conduct your own research before making any financial decision.