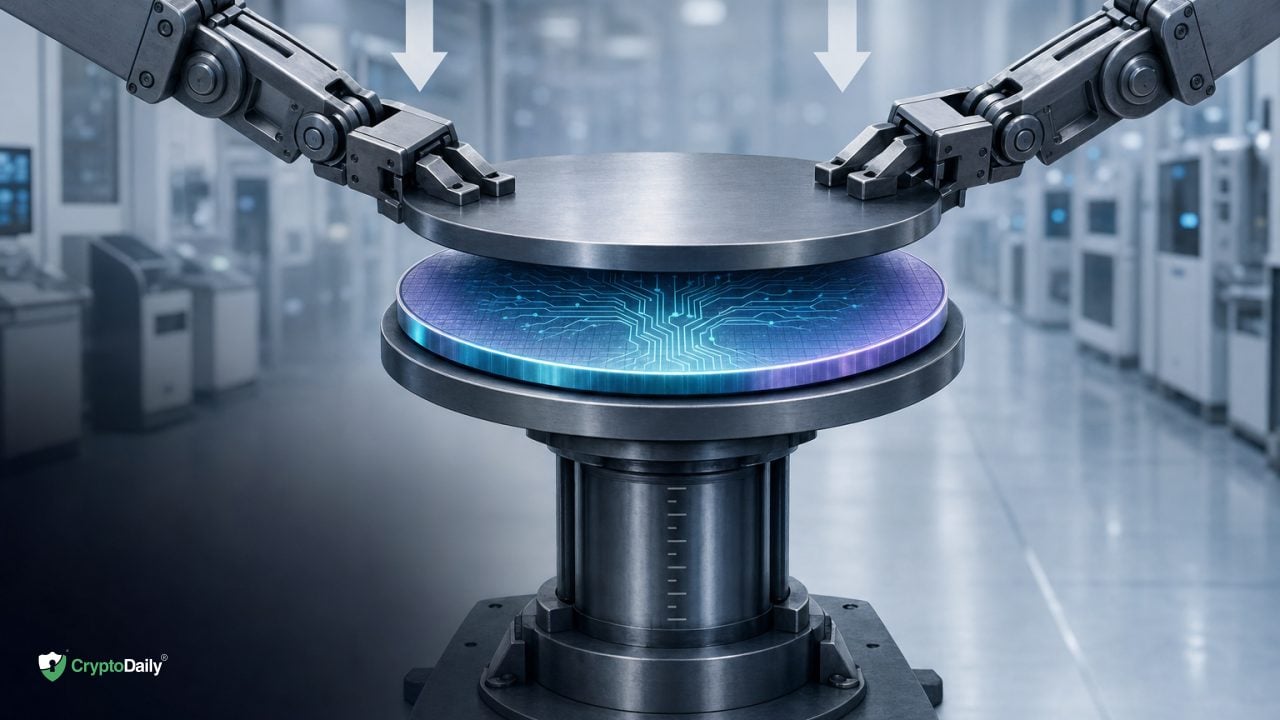
Applied Materials posted record results and raised guidance, confirming that AI demand is still pulling forward equipment spending. Verified fact: the company reported Q2 FY2026 revenue of $7
Applied Materials posted record results and raised guidance, confirming that AI demand is still pulling forward equipment spending. Verified fact: the company reported Q2 FY2026 revenue of $7.91 billion, GAAP EPS of $3.51, non-GAAP EPS of $2.86, non-GAAP gross margin around 50.0%, and guided Q3 FY2026 revenue to $8,950 million ± $500 million, per its earnings release on May 14, 2026 (company PDF).
Yet the same AI tide is lifting multiple boats. Verified fact: Lam Research, a direct competitor in etch and deposition, also posted a record June quarter with $6.722 billion in revenue and guided the September quarter to $8.10 billion ± $400 million (Lam Research). Opinion: when several leaders simultaneously beat and guide higher, the market tends to reward the group rather than grant a lasting “AI premium” to a single vendor.
Two additional checks on a runaway premium stand out. Verified fact: Applied’s non-GAAP free cash flow fell to $210 million in Q2 FY2026 from $1,061 million a year earlier, an approximately 80% drop, even as revenue and EPS set records (company PDF). Verified fact: Applied in February 2026 agreed to pay $252.5 million to resolve U.S. Department of Commerce export-control matters; related DOJ and SEC probes were subsequently closed (company press release). Market narrative: strong demand, tighter cash conversion, and a live regulatory backdrop argue for a balanced view on valuation.
What changed in Applied’s setup this quarter
Verified facts:
- Record Q2 FY2026 performance: revenue $7.91 billion; GAAP EPS $3.51; non-GAAP EPS $2.86; non-GAAP gross margin about 50.0% (company PDF).
- Raised outlook: Q3 FY2026 revenue guidance of $8,950 million ± $500 million, consistent with continued AI-driven equipment demand (company PDF).
- Cash conversion caution: non-GAAP free cash flow of $210 million versus $1,061 million in Q2 FY2025 (~80% decline) (company PDF).
- Regulatory overhang clarified: $252.5 million settlement with U.S. Commerce (BIS); DOJ and SEC closed related probes (company press release).
Inference: The operational trajectory is improving on revenue and margins, but cash generation and export controls remain gating items for how much of an AI multiple investors are willing to ascribe.
The strongest evidence from AMAT, a key rival, and the market
Verified facts from primary sources and industry data underpin the thesis that demand is broad and competition is intense:
ItemFigure / GuidanceSource Applied Q2 FY2026 revenue$7.91BApplied Materials Applied Q2 FY2026 GAAP / non-GAAP EPS$3.51 / $2.86Applied Materials Applied non-GAAP gross margin~50.0%Applied Materials Applied Q3 FY2026 revenue guide$8,950M ± $500MApplied Materials Applied non-GAAP free cash flow$210M (Q2 FY2026) vs. $1,061M (Q2 FY2025)Applied Materials Lam Research June-quarter revenue$6.722BLam Research Lam Research September-quarter guide$8.10B ± $400MLam Research SEMI WFE forecast (2026)~$143.9BSEMI SEMI total equipment forecast (2027)~$156BSEMI
Market narrative: SEMI’s larger total addressable market attracts multiple tier-one suppliers. Verified fact: independent research estimates show the “Big Five” equipment makers account for roughly 65–70% of front-end WFE, which means leading chipmakers can dual-source advanced tools and keep pricing in check (Mordor Intelligence).
Why valuation upside meets market-share math
Opinion: Applied’s setup argues for respect rather than exuberance. Revenue and margin execution are tracking ahead of plan, and guidance implies AI orders still have legs. But the same AI wave is allocating revenue across multiple OEMs, as Lam’s beat and guidance underscore. The structural reality that customers can source leading-edge tools from several vendors limits the scope for a single-supplier pricing premium in a rising cycle.
Verified fact: SEMI highlights China, Taiwan and Korea as primary destinations for equipment spending through 2027 and notes continued capacity builds in China, including mature nodes (SEMI). Inference: subsidized local suppliers in China at trailing nodes can pressure pricing on lower-end lines, further capping the blended margin expansion investors might extrapolate from AI-led tools.
Verified fact: Applied resolved a $252.5 million export-control matter with the U.S. Commerce Department in February 2026 (company press release). Market narrative: while closure reduces legal uncertainty, geopolitics remain an operational risk that investors tend to discount when calibrating an AI premium for globally exposed suppliers.
What this cycle means for equipment suppliers and customers
Market narrative: A bigger TAM does not automatically deliver outsized economics to any one OEM. Verified fact: SEMI projects WFE to about $143.9 billion in 2026 and total equipment sales toward ~$156 billion in 2027 (SEMI). Inference: chipmakers will wield that buying power to secure supply, negotiate terms, and maintain multi-vendor optionality across etch, deposition and other front-end steps.
For customers, broad vendor strength is a feature, not a bug. Opinion: in an AI buildout that prizes uptime and fast ramps, dual-sourcing reduces implementation risk and keeps lead times and service quality competitive. That is healthy for the ecosystem, but it also slows the emergence of a persistent winner-take-most valuation within the equipment group.
The strongest counterargument to a capped AI premium
Market narrative: The bull case is that AI demand will outpace industry capacity for longer than expected, allowing leading OEMs to sustain high utilization, attractive mix, and operating leverage. Opinion: if the mix tilts toward the most advanced tools where fewer suppliers qualify, top vendors could command better pricing or priority allocations, keeping multiples elevated.
What would have to be true? Evidence of persistent supply constraints at advanced nodes, visible share gains versus peers in high-value steps, and a clear rebound in free cash flow conversion would all strengthen the case for a durable premium at the company level.
What would confirm or weaken this thesis
- Delivery versus guide: Whether Applied’s Q3 FY2026 revenue lands near the midpoint of $8,950 million ± $500 million, and any commentary on AI-led order visibility (company PDF).
- Cash conversion: Trajectory of non-GAAP free cash flow over the next quarters relative to record revenue levels (company PDF).
- Peer read-throughs: Lam Research’s September-quarter results versus $8.10 billion ± $400 million guidance as a proxy for shared AI demand (Lam Research).
- TAM updates and regional mix: SEMI’s next forecasts for WFE and total equipment, with attention to China, Taiwan and Korea exposure and any shift in China’s mature-node investments (SEMI).
- Regulatory landscape: Any changes in U.S. export controls that affect shipment timing or addressable markets, especially for China.
- Competitive dynamics: Signs of pricing discipline or erosion, win-rate disclosures, and margin commentary from the Big Five; persistent multi-vendor strength would support the “capped premium” view (Mordor Intelligence).
Editorial conclusion: Verified results and guidance show Applied executing well into an AI upcycle. Reasonable inference says that the same upcycle is diversified across top OEMs, while cash conversion and geopolitics restrain how high a single-vendor AI premium can run. The burden of proof now sits with sustained free cash flow, share gains, and evidence that competition cannot blunt pricing at scale.
Disclaimer: This article is provided for informational purposes only. It is not offered or intended to be used as legal, tax, investment, financial, or other advice.