Can a chart genuinely hold two competing stories at once, one bullish, one bearish, without picking a side yet? That's exactly where the APRZ listing conversation sits right now, and it's wor
Can a chart genuinely hold two competing stories at once, one bullish, one bearish, without picking a side yet?
That's exactly where the APRZ listing conversation sits right now, and it's worth resisting the urge to force a conclusion the price action itself has not given.
The token pushed a real recovery off deeper lows in recent sessions, but it's now consolidating right at the exact zone that will determine whether that recovery holds or fails.
Reading this chart honestly and reading the current state of the APRZ listing itself means acknowledging both outcomes remain genuinely live.
APRZ Price Prediction: Where Price Sits Right Now
The current APRZ/SOL chart on Orca, viewed on the 4-hour timeframe, shows the token trading at $0.0003046, down 0.16% from an open of $0.0003051, essentially flat on this specific candle.
That places the price sitting inside the Support-1 zone spanning roughly $0.0003000 to $0.0003080, the same box that capped earlier rally attempts before flipping into support during the recovery leg.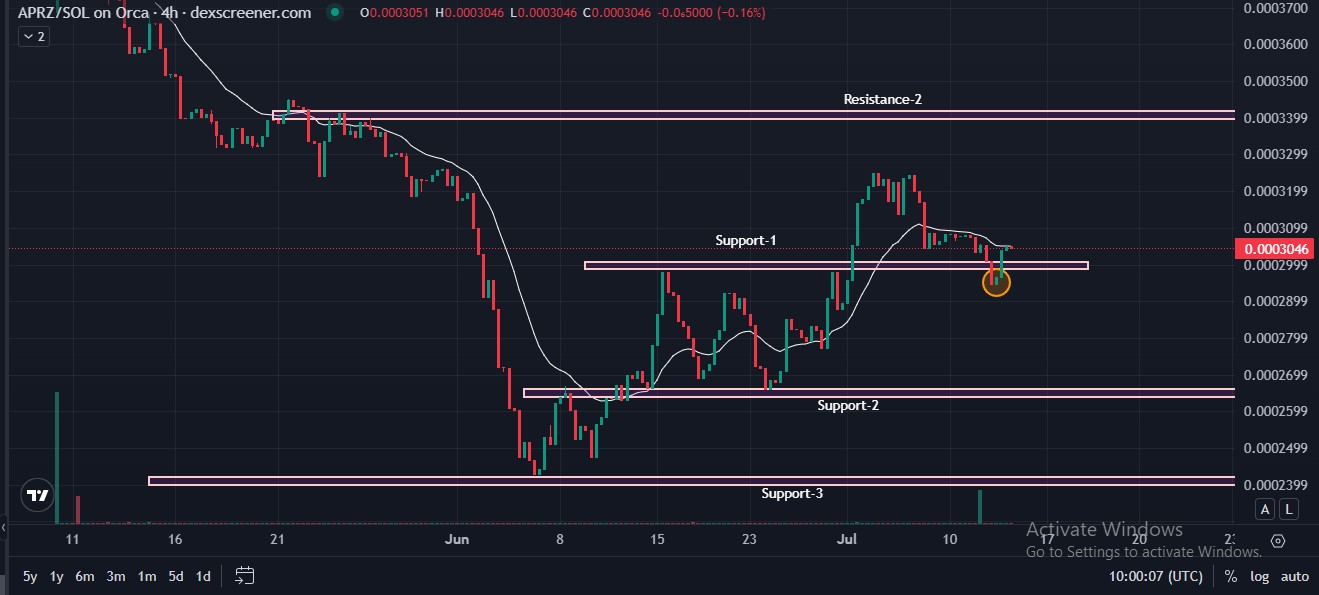
Source: Chart by DexScreener
A specific recent candle near this level has been marked on the chart, reflecting the exact test point traders are watching most closely.
Below, Support-2 sits near $0.0002600 and Support-3 near $0.0002400, both still untested in this leg. Above, Resistance-2 sits near $0.0003400, the level that capped the broader decline earlier in the chart's history.
APRZ Chart Snapshot
Latest technical levels and market position
MetricValueCurrent Price$0.0003046Candle Change-0.16%Open$0.0003051PositionInside the Support-1 zone (~$0.0003000–$0.0003080)Support-2~$0.0002600Resistance-2~$0.0003400
Recovery or Bear Trap: Why Neither Is Confirmed Yet
The honest answer to the headline's question is that the chart has not resolved it either way.
A genuine recovery reading points to the fact that the APRZ climbed meaningfully off its deeper lows near Support-2 and Support-3 and has since held inside, rather than below, the Support-1 zone for multiple sessions, real, sustained ground gained rather than a single green candle.
A bear trap reading points to the fact that the price has stalled precisely at this zone without a confirmed breakout above it, the same pattern that would precede a failed recovery rolling back over.
Both readings are supported by different parts of the same chart, which is exactly why forcing a conclusion right now would be reading more certainty into the data than it currently offers.
What Would Actually Settle the Question
Rather than guess, the more useful approach is defining the specific conditions that would resolve this either way, the kind of structured read any solid APRZ technical analysis should rely on instead of gut feeling.
A confirmed close above Resistance-2 near $0.0003400 with rising volume would strongly favour the recovery case, since it would mean the price cleared not just the immediate zone but the level above it too.
A break back below $0.0003000, especially one that doesn't quickly reclaim the zone, would favour the bear trap case, opening a path back toward support 2.
Continued sideways drift inside the current range, which is essentially what today's -0.16% candle represents, simply extends the uncertainty without resolving it in either direction.
ApeMars Price Prediction: Bear, Base, and Bull Scenarios
Every grounded ApeMars price prediction right now has to build directly from this unresolved consolidation rather than assuming either outcome.
APRZ Price Prediction Scenarios
Possible near-term outcomes based on key technical levels
ScenarioTrigger ConditionsNear-Term TargetBear CaseA decisive break below
$0.0003000 confirms the bear trap scenario.$0.00024 – $0.00026(Toward Support-2 / Support-3)Base CasePrice continues consolidating inside the
Support-1 zone.$0.00030 – $0.00034Bull CaseA confirmed close and sustained hold above
Resistance-2 with rising trading volume.$0.00034 – $0.00040
The base case reflects simply more of what's happening right now, a range-bound token neither confirming nor denying either story.
The bear and bull cases each require a specific, checkable trigger, not just continued sideways movement.
Expert View: APRZ Listing and Trading a Genuinely Undecided Chart
Analysts reviewing ApeMars note that the most disciplined approach to a chart like this one is resisting the urge to pick a side before the data does.
Consolidation directly inside a former resistance-turned-support zone, without a confirmed break in either direction, is a textbook "wait for confirmation" setup rather than a signal to act on either the recovery or the trap thesis prematurely.
For verified project updates, including any future CEX listing news, the official ApeMars X account and website remain the most reliable sources, since chart-based speculation alone cannot confirm off-chain developments like an exchange listing.
Disclaimer
This article is for informational purposes only and does not constitute financial or investment advice. All APRZ price prediction figures, resistance and support levels, and listing speculation mentioned are based on publicly available chart data and are not guaranteed outcomes. No official CEX listing has been confirmed at the time of writing. Cryptocurrency investments carry significant risk, including potential loss of capital. Always do your own research and verify information through official channels.