How does an ApeMars price drop happen with no actual selling behind it? That's the strange detail sitting at the center of the current APRZ launch conversation. The latest candle shows the to
How does an ApeMars price drop happen with no actual selling behind it?
That's the strange detail sitting at the center of the current APRZ launch conversation.
The latest candle shows the token ticking down, yet the volume reading on that same candle sits at zero no meaningful trades pushing it lower, no wave of sellers dumping into the market, just a small dip with essentially nothing behind it.
That mismatch between price and actual trading activity is exactly the kind of signal worth understanding properly before assuming it means anything about where ApeMars goes next.
APRZ Price Prediction: What the Zero-Volume Candle Shows
The current APRZ/SOL chart on Orca, viewed on the 4-hour timeframe, shows the token trading at $0.0003076, down 0.23% from an open of $0.0003083, with volume on this candle reading exactly 0.
The 20-period EMA sits at $0.0003090, just above the current price, meaning the token is trading marginally below its own short-term average even as broader momentum from recent weeks remains intact.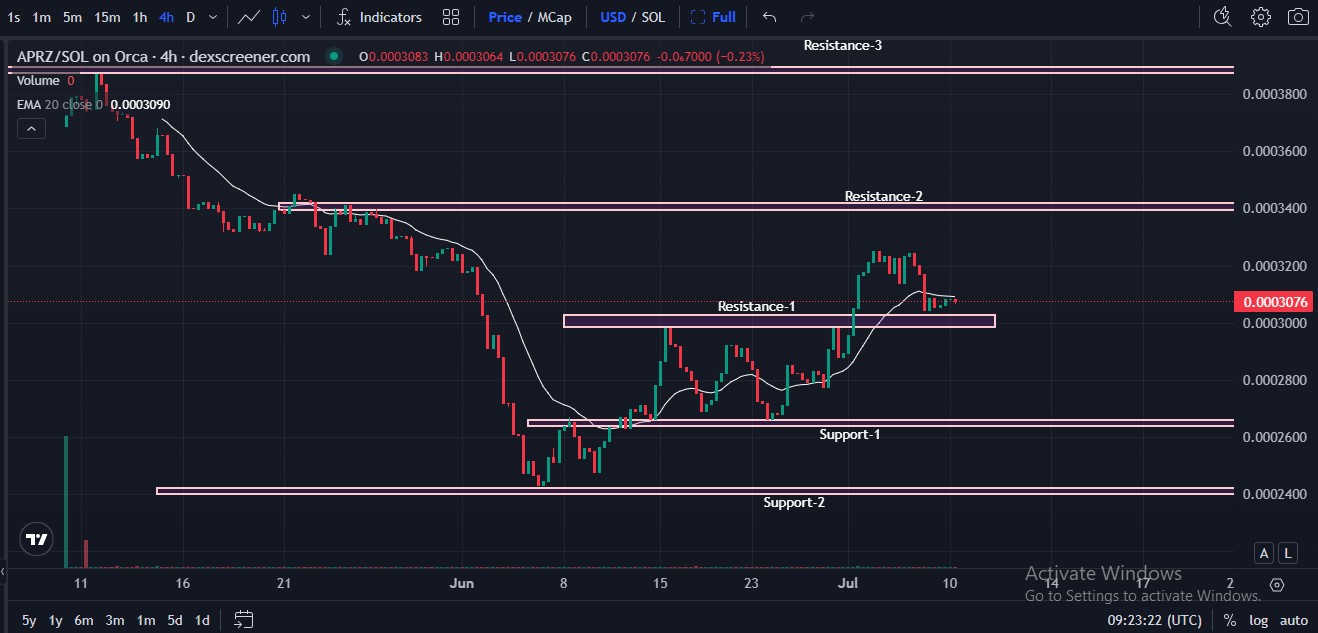
Source:Chart by Dexscreener
A price move with zero recorded volume typically reflects a last-quote adjustment on thin liquidity rather than genuine sell pressure, since there's no actual trade size behind the tick.
That distinction matters directly for anyone treating this as a bearish signal a move like this says more about how quiet the market currently is than about buyers or sellers actively fighting for control.
APRZ Chart SnapshotValueCurrent Price$0.0003076Candle Change-0.23%Candle Volume0Open$0.0003083EMA 20 (Close)$0.0003090Resistance-2~$0.0003400Resistance-1 Zone~$0.0003000–$0.0003080Support-1~$0.0002600Support-2~$0.0002400
APRZ Technical Analysis: The Full Resistance Ladder
Zooming out on this APRZ technical analysis, the chart maps out four distinct levels above and below the current price, forming a clear ladder structure.
Resistance-3 sits well above current action near the very top of the visible range, a level the token has not approached since its steep decline earlier in the chart's history.
Resistance-2 sits closer at roughly $0.0003400, marking the zone where the initial downtrend first accelerated.
Resistance-1 forms a wider box spanning roughly $0.0003000 to $0.0003080, the same area price is currently sitting inside, making it the most immediate battleground rather than a distant target.
Below the current price, Support-1 near $0.0002600 and Support-2 near $0.0002400 mark the two floors that held during the token's deepest pullback, giving traders a defined downside reference if the current zero-volume drift turns into real selling.
ApeMars Resistance & Support LadderLevelResistance-3Far above current range, untested recentlyResistance-2~$0.0003400Resistance-1 (Current Zone)~$0.0003000–$0.0003080Support-1~$0.0002600Support-2~$0.0002400APRZ Listing: What's Confirmed Away From the Chart
Separate from the technical picture, the APRZ listing situation remains unchanged: no centralized exchange listing has been officially confirmed by the project as of now.
APRZ continues trading exclusively through decentralized venues, and today's zero-volume candle is a direct symptom of that limited liquidity rather than a market rejecting the token outright.
ApeMars' published tokenomics confirm a 70 billion total supply with a 50% presale allocation and a documented two-month staking lock on rewards specifically.
Scheduled burns at Stages 6, 12, 18, and 23 remain the project's confirmed deflationary mechanism, continuing on schedule regardless of how this current consolidation resolves.
ConfirmedUnconfirmed / SpeculativeApeMars trades exclusively on DEX platforms (Orca)Timing of any centralized exchange (CEX) listingZero-volume candle reflects thin liquidity, not confirmed selling pressureWhether Resistance-1 breaks or holds on the next high-volume candleScheduled token burns at Stages 6, 12, 18, and 23Sustained daily trading volume needed to confirm a genuine trendAPRZ Price Prediction: Weighing Thin Liquidity Against Structure
Every serious APRZ price prediction has to separate genuine market signals from artifacts of low liquidity, and this is a clean example of the difference.
A cautious APRZ price prediction treats today's zero-volume dip as noise rather than a confirmed reversal, since there's no actual trading activity validating the move.
A more constructive $APRZ price prediction points to the token still holding within the Resistance-1 zone rather than breaking down toward Support-1, suggesting the broader recovery structure from recent lows remains intact despite the quiet session.
The most balanced ApeMars price prediction simply waits for the next candle with real volume behind it, since that's what will actually confirm whether this zone breaks higher toward Resistance-2 or gives way toward the support levels below.
Expert View: APRZ Price Prediction and Reading Thin-Volume Moves
Analysts reviewing ApeMars note that zero-volume price ticks are common in low-liquidity DEX pairs and should not be treated with the same weight as a high-volume breakout or breakdown candle.
The genuinely useful signal here isn't the -0.23% move itself; it's whether the next several candles bring real volume back into the Resistance-1 zone.
For verified project updates, including any future CEX listing news that could meaningfully improve liquidity, the official ApeMars X account and website remain the most reliable sources, since chart-based speculation alone can't confirm off-chain developments like an exchange listing.
Disclaimer
This article is for informational purposes only and does not constitute financial or investment advice. All ApeMars price prediction figures, resistance and support levels, and listing speculation mentioned are based on publicly available chart data and project statements and are not guaranteed outcomes. No official CEX listing has been confirmed at the time of writing. Cryptocurrency investments carry significant risk, including potential loss of capital. Always do your own research and verify information through official channels.