$ARB is pressing against the ceiling of a channel that has kept it under pressure for months, and it is doing so just as a fresh batch of tokens hits the market. Whether buyers can hold this
$ARB is pressing against the ceiling of a channel that has kept it under pressure for months, and it is doing so just as a fresh batch of tokens hits the market.
Whether buyers can hold this line or sellers push it back down is the question shaping thisArbitrum Price Prediction, which walks through the unlock event, derivatives positioning, and the chart levels that matter most right now.
What Is Driving ARB Price Today?
$ARB is trading at $0.07462, up 1.06% over the last 24 hours.Market cap data puts the figure at $493.59M, also up 1.06%. 24-hour volume has climbed 16.63% to $31.57M, against a fully diluted valuation of $746.28M, a 10B $ARB total supply, and $6.61B ARB currently in circulation.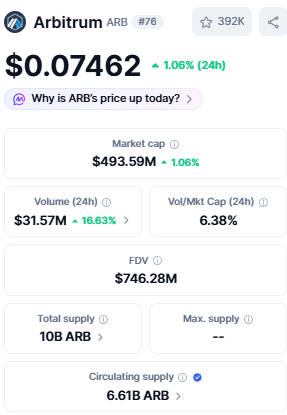
Token Unlock Event: Fresh Supply Hits the Market
According to Tokenomist unlock event data, $ARB went through a release event valued at $6,737,576, covering 92,645,834 ARB, or roughly 1.61% of the allocated supply.
The release was scheduled for 16 August 2026 at 13:00 UTC and moved through vesting and timelock mechanisms.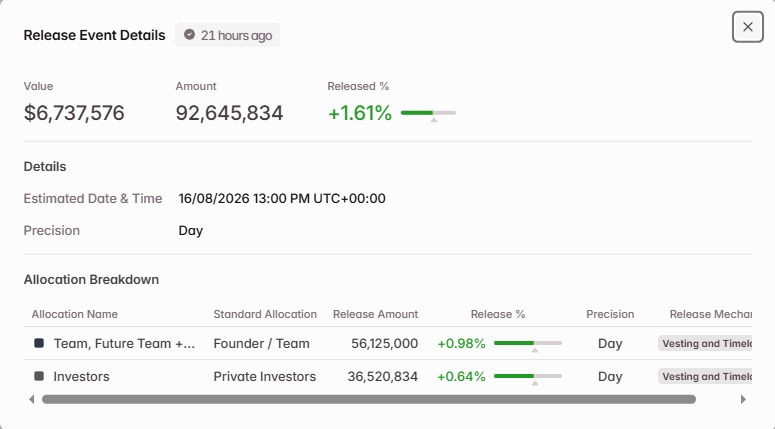 The breakdown skews toward insiders: $56,125,000 ARB (0.98%) came from the team and future team allocation, while $36,520,834 ARB (0.64%) came from private investors.
Unlocks weighted this heavily toward team and investor wallets are worth watching, since these holders are typically more price-sensitive than long-term retail holders.
What Are Futures Traders Signalling?
As per Coinglass data, futures volume is led by Binance at $15.68M, followed by BingX ($13.55M), Bybit ($9.29M), WhiteBIT ($7.33M), OKX ($6.03M), and MEXC ($5.26M), with the remainder spread across Gate, KuCoin, Hyperliquid, Bitget, Bitunix, and Kraken.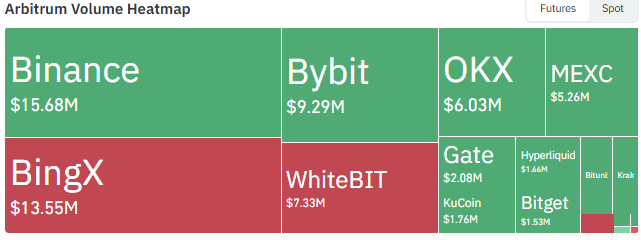
Open interest stands at $89.66M as of 17 August 2026, near the upper end of a range that has held mostly between $70M and $90M since early July, after an earlier spike above $100M in mid-July.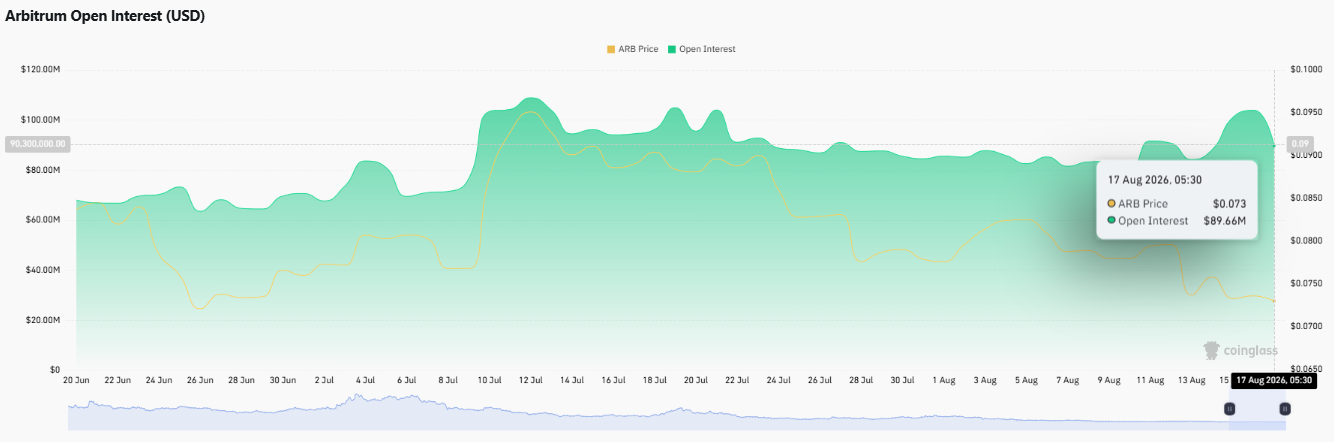
Positioning leans long across exchanges. Binance's account-based long/short ratio sits at 1.2447, and OKX runs higher at 1.95. Binance's top trader accounts show a 1.5694 ratio, while the position-weighted long/short ratio for top traders is higher still at 1.6352, pointing to conviction among larger positions.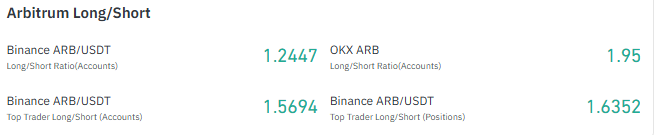
Liquidations over the past day have been almost entirely one-sided. Total 24-hour liquidations reached $120.82K, with $110.19K coming from long positions against just $10.63K in shorts.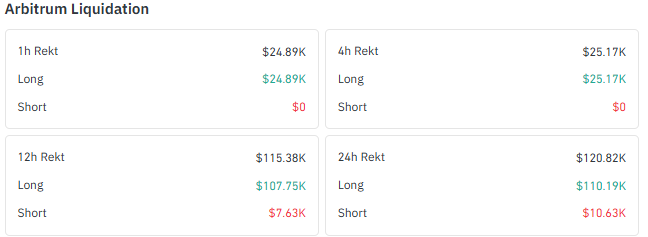
The 1h and 4h windows show longs accounting for effectively all of the liquidations, a sign that leveraged buyers have been getting caught out during pullbacks within the range.
Technical Analysis: Breakout or More Range Trading?
As per the TradingView chart, $ARB is pressing against the upper boundary of its descending channel, making the $0.08134 resistance the key test.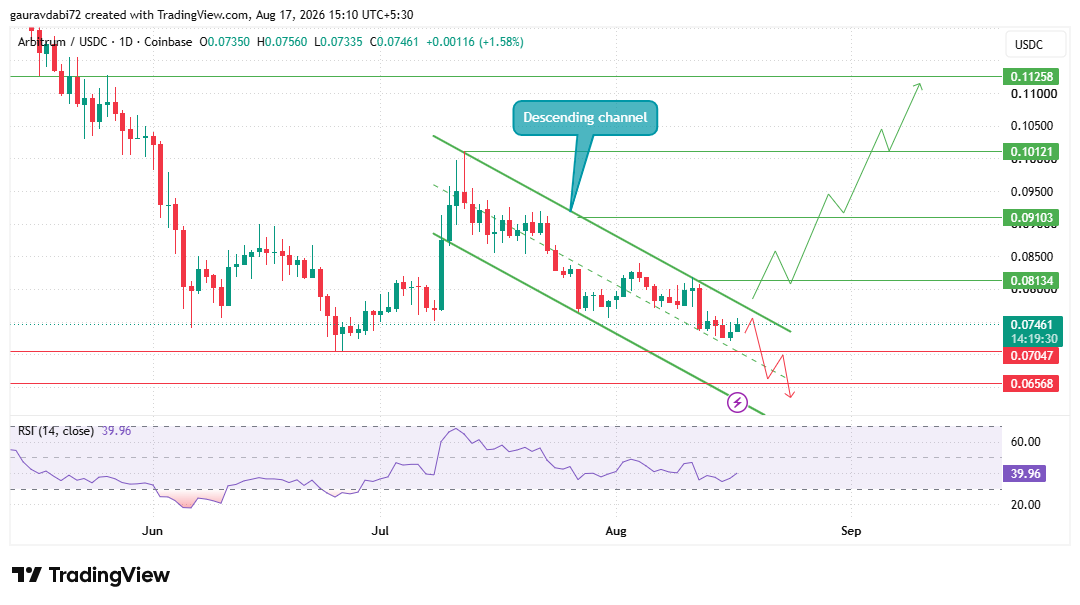
This isn't the first time $ARB hastested a trendline breakout this cycle, but a daily close and sustained hold above this level would weaken the current bearish structure and put $0.09103 in focus, followed by $0.10121 and $0.11258.
If sellers defend the channel top, $ARB could continue moving inside the range for the coming weeks.
A rejection would bring $0.07047 back into focus, while a deeper breakdown could expose $0.06568.
A breakout alert flagged similar price targets back in July, and that setup faded without follow-through, a reminder that this level has rejected attempts before.
The setup is simple for now. $0.08134 decides whether $ARB starts breaking out or remains trapped inside the channel.
Arbitrum Price Prediction: Bull, Neutral and Bear Scenarios
Bullish Case
A daily breakout and sustained hold above $0.08134 would weaken the current bearish structure and put $0.09103 in focus, followed by $0.10121 and $0.11258.
Neutral Case
If sellers defend the channel top, $ARB could continue moving inside the range for the coming weeks without a clean resolution either way.
Bearish Case
A rejection at $0.08134 would bring $0.07047 back into focus, while a deeper breakdown could expose $0.06568.
$ARBis down 0.69% over the past 4 hours but up 1.08% over 24 hours, even as the 7-day figure remains negative at -3.85%.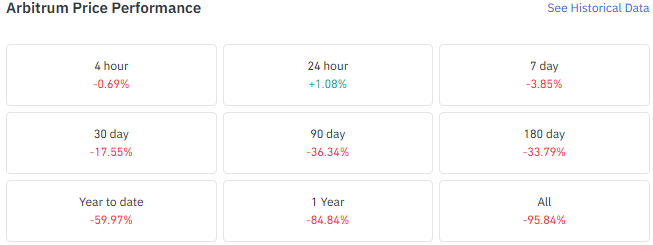
The decline is steeper further out, with $ARB down 17.55% over 30 days, 36.34% over 90 days, and 33.79% over six months.
Longer term, the token is down 59.97% year to date, 84.84% over the past year, and 95.84% since inception.
Sharp counter-trend moves are not unheard of on a chart this beaten down, a pattern covered in earlier coverage ofARB's revenge rally shock, though the scale of the longer-term drawdown remains the dominant story.
What We're Watching Next
As per the CoinGabbar analyst, the $0.08134 level is the clearest line in the sand on ARB's chart, and the token's ability to close above it will matter more than any single day's move.
Broader August coverage of ARB's price outlook has flagged this same range as the key battleground, and with a fresh unlock adding to available supply, sustained buyer demand becomes even more important for any breakout attempt to hold.
Disclaimer: This article is for informational purposes only and should not be considered financial or investment advice. Cryptocurrency markets are highly volatile, and prices can move sharply in either direction. Readers should conduct their own research and consult a qualified financial advisor before making any investment decisions.