Is ARB about to bounce from the $0.1351 support level, or is ARB going to test lower support? This Arbitrum price prediction begins with ARB trading near the lower line of a falling wedge, a
Is ARB about to bounce from the $0.1351 support level, or is ARB going to test lower support?
This Arbitrum price prediction begins with ARB trading near the lower line of a falling wedge, a pattern of two converging lines that slope down. The widerArbitrum November 2026 forecast hinges on whether buyers defend the nearest support level, a price where buyers have stepped in before. Sellers still cap rallies at each resistance level
Arbitrum Price Forecast: 24-Hour Market Snapshot
CoinGecko market data ranks ARB at 72nd with a market cap of $953.94M.
Metric
Value
Price
$0.1384
7-day change
-16.4%
24h range
$0.1383 to $0.1502
Market cap
$953.94M
FDV
$1.384B
24h volume
$107.56M
Circulating supply
6.892B ARB
Total supply
10B ARB
Source: CoinGecko Data, $ARB market snapshot, captured Nov 14, 2026, 08:27 UTC
Fully diluted valuation, prices every token at today's rate, including supply that hasn't reached the market. Here it sits at $1.384B against a $953.94M market cap.
With 31.1% of the 10B max supply still to reach the market, new tokens can add sell pressure.
ARB Whale Concentration: Top 100 Holders Control 71.20%
Arbiscan holder data shows whales make up 0.03% of holders yet hold 92.45% of the market cap.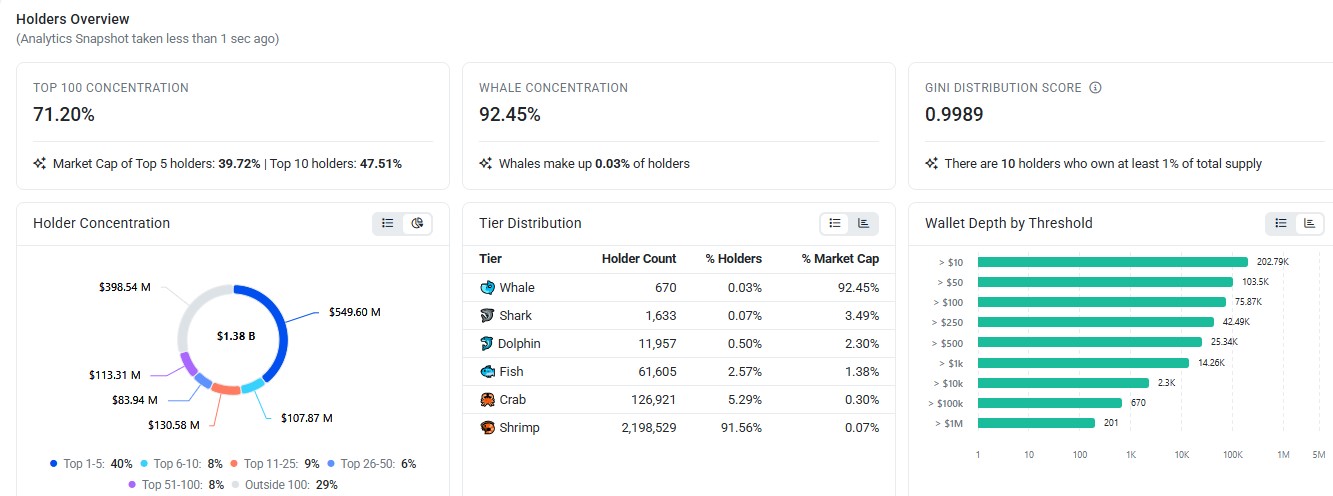
Source:ARB holders overview, captured Nov 14, 2026, 08:27 UTC
The top 5 holders account for 39.72% and the top 10 for 47.51%. Ten holders each own at least 1% of total supply. The top 100 hold 71.20%.
When a few wallets hold most of the supply, one large transfer to an exchange can add sell pressure.
ARB Liquidation Data: Longs Take 91.8% of 24-Hour Losses
Longs are getting hit. Liquidation data from CoinGlass shows $707.09K in long liquidations over 24 hours against $62.96K for shorts. A liquidation is a forced exit when margin on a leveraged trade runs out.
Window
Longs
Shorts
Total
1h
$146.68K
$106.52
$146.79K
4h
$150.68K
$13.67K
$164.35K
12h
$667.37K
$17.04K
$684.41K
24h
$707.09K
$62.96K
$770.06K
the $150.68K in long liquidations over 4 hours, $146.68K hit in the final hour. Over the last 12 hours, longs took $667.37K of the losses. Long liquidations create forced sell orders, so they add pressure on the way down. Short liquidations force buying, and $62.96K is too small to lift price.
ARB Open Interest and Futures Volume Fade Across Exchanges
Open interest is the total value of futures contracts still open. CoinGlass data puts futures volume at $178.87M over 24 hours.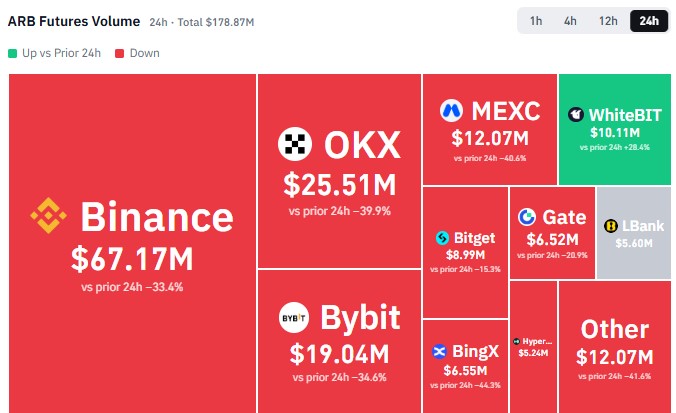
Source: CoinGlass, $ARB futures volume by exchange, 24h, captured Nov 14, 2026, 08:27 UTC
Binance recorded $67.17M in futures volume, and OKX $25.51M. Bybit added $19.04M and MEXC $12.07M.
Volume fell 33.4% on Binance and 39.9% on OKX against the prior 24 hours. Traders hunting a catalyst can scan thelatest crypto news for token-specific updates. Falling volume reads like fading interest. Actually, make that selective interest, since WhiteBIT volume rose 28.4%.
On open interest, Binance holds $38.07M and Gate $24.75M. Bybit holds $20.12M.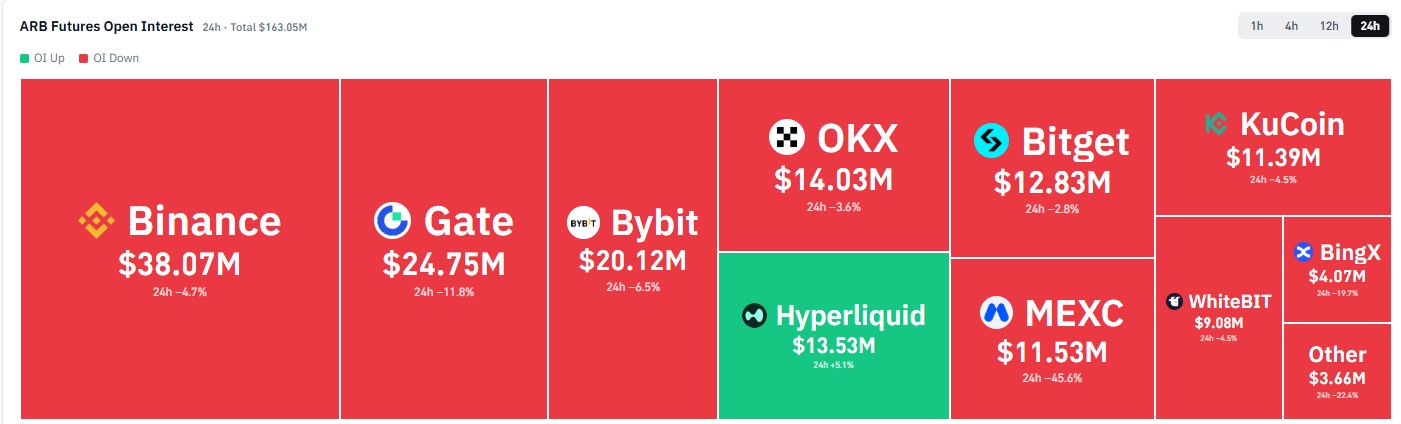
Source: CoinGlass, $ARB futures open interest by exchange, 24h, captured Nov 14, 2026, 08:27 UTC.
Total open interest on CoinGlass is $163.05M, and MEXC fell 45.6%, the sharpest drop. Who's still adding risk? Only Hyperliquid, where open interest rose 5.1% to $13.53M.
Falling open interest during a drop means traders are unwinding positions, so selling pressure comes from exits rather than new shorts.
ARB Technical Analysis: 50 EMA and RSI Levels 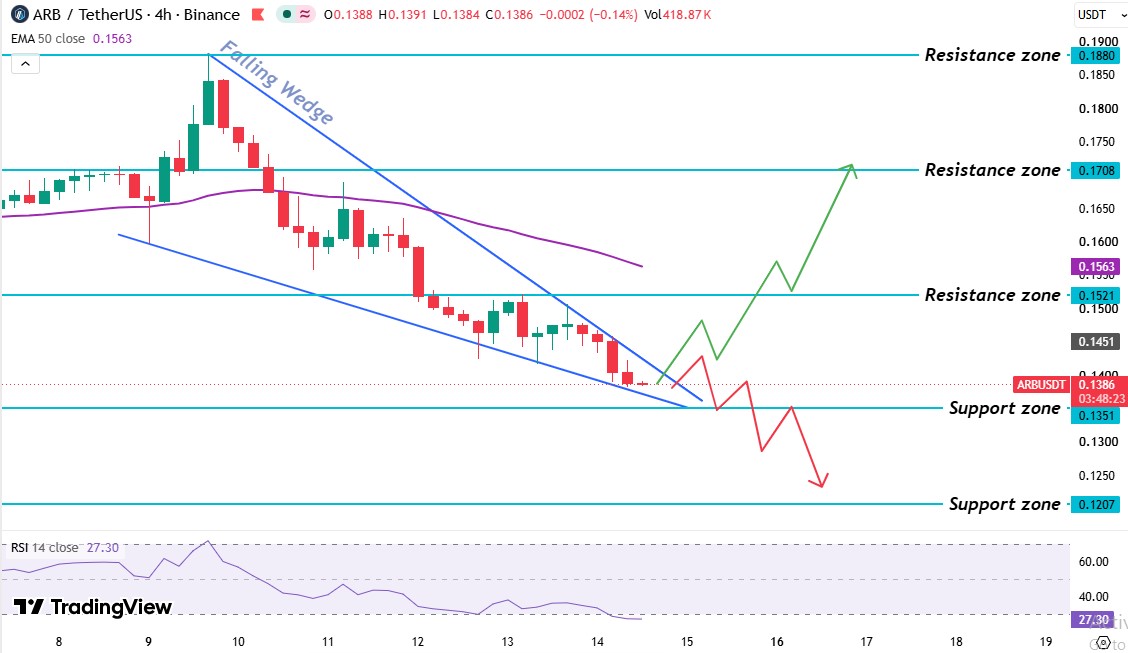
Source: TradingView, $ARB/USDT 4H, captured Nov 14, 2026, 08:27 UTC
The Binance 4-hour chart on TradingView frames this Arbitrum price prediction. A November rally pushed ARB up to the $0.1880 level before sellers took control.
Before the rally, the price drifted sideways near the $0.1708 resistance level. Buyers broke through, and ARB ran to $0.1880, where sellers rejected the move. The slide that followed took the price under the 50 EMA. Then the price fell through $0.1521, a support level where buyers had stepped in before. Buyers tried twice to reclaim it and failed both times, so a broken support level now acts as a resistance level.
AnyARB resistance breakout has to start at that flipped $0.1521 level. Since the $0.1880 high, the price has moved inside a falling wedge, a pattern where lower highs and lower lows squeeze between two down-sloping lines. A break above the upper trendline is the first bullish sign, and a drop below the lower line tests the $0.1351 support level.
The $ARB 50 EMA sits at $0.1563. $ARB's $0.1384 price trades 11.5% below it, and the latest candle trades below it too. The broken $0.1521 support level sits beneath it, so a real recovery needs a candle trading above both.
The $ARB RSI reads 27.30 on the 14-period setting. Under 50 means sellers hold the edge. Under 30 means selling has gone too far, so a bounce is possible.
ARB Support and Resistance Levels
Level
Type
$0.1880
Resistance level
$0.1708
Resistance level
$0.1563
50 EMA
$0.1521
Resistance level
$0.1351
Support level
$0.1207
Support level
The nearest support level is $0.1351, and the nearest resistance level is $0.1521.
Arbitrum Price Forecast: Bull, Base, and Bear Scenarios
Scenario
Trigger
Target
Invalidation
Bull
Daily candle trades above $0.1521
$0.1708 then $0.1880
Falls back below $0.1521
Base
Price stays between $0.1351 and $0.1521.
Sideways trade inside that range
Daily candle breaks either level.
Bear
Daily candle trades below $0.1351
$0.1207
Daily candle trades above $0.1521
Risks to this Arbitrum price prediction are mostly technical. A regulatory delay could still hit sentiment. And a daily candle trading above $0.1521 would break the bearish setup.
Expert Outlook: Arbitrum Price Prediction
According to CoinGabbar analysis, this Arbitrum price prediction favors sellers while price trades under the 50 EMA. Longs took 91.8% of 24-hour liquidations, and open interest fell on most major venues. But RSI at 27.30 leaves room for a short bounce toward $0.1521. A sustained recovery needs a candle trading above $0.1563.
The cleaner signal is open interest at support. If it rises while the price holds $0.1351, new buyers are stepping in.
Disclaimer: This article is for information only and isn't financial advice. Traders should do their own research and risk only what they can afford to lose.