This XRP price prediction starts near $1.34, where the token trades after a rough session driven by hot inflation data. Bulls stepped in around $1.25 and pushed the price back up. The token i
This XRP price prediction starts near $1.34, where the token trades after a rough session driven by hot inflation data. Bulls stepped in around $1.25 and pushed the price back up.
The token is up 1.81% in 24 hours. That is slightly better than the wider market gain of 1.69%.
Still, it sits well below the recent high near $1.65. Below, we look at ETF flows, whale activity, derivatives, and chart levels.
XRP Price Today: How Much Is $XRP Trading For?
For anyone checking the XRP price today, the token sits at $1.3409, up $0.02384 on the day. Its market cap is $84.58 billion.
Spot volume is $491.09 million. Circulating supply is 63.12 billion tokens, out of 99.98 billion total and a 100 billion max supply.
After forming a high near $1.65, the price corrected by almost 22%. Buyers are now trying to build a base.
XRP News Today: Why Did XRP Fall After the PPI Report?
In $XRP news today, the big story is inflation. The coin dropped by nearly 6% at one point in the session after U.S. Producer Price Index (PPI) data surprised the market.
Indicator
Analysts Expected
Actual Reading
PPI (monthly)
0.5%
1.3%
Core PPI (September)
0.3%
0.7%
Core PPI was up 50 basis points versus the previous month. Higher energy prices keep pushing wholesale costs up.
The Consumer Price Index (CPI) a day earlier also beat forecasts. Two hot reports in a row could have set the stage for a bigger correction.
That combo can scare traders away from risky assets. Even so, bulls defended the $1.25 area and lifted the price to a session high of $1.35.
XRP Latest News: Are Whales Moving XRP to Binance?
The XRP latest news from on-chain data is worth a look. CryptoQuant says whale inflows to Binance hit a seven-month high.
The chart tracks daily whale inflows and their 30-day total. The 30-day total is now near 1.6 billion, up from a low around 600 million in late July and early August.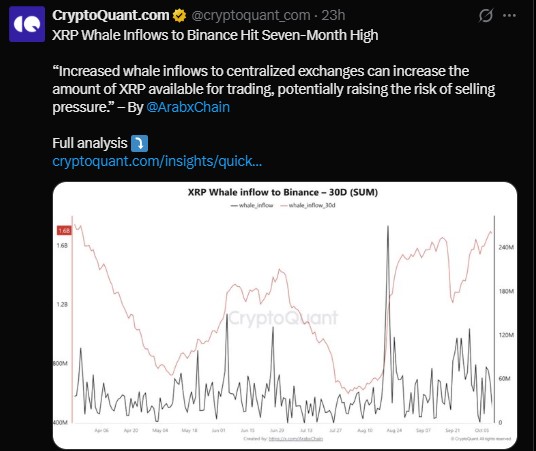
Reading (approximate, from the chart)
Level
30-day total of whale inflows, latest
About 1.6B
30-day total, low in late July to early August
About 600M
Biggest single-day inflow, late August
About 270M
Recent daily peaks, late September
About 125M
Analyst ArabxChain says more coins on exchanges can mean more supply for trading. That can raise selling pressure.
The late August spike lines up with the sharp rally to $1.70. Daily inflows have stayed busy since then, but none has matched that peak.
But an inflow is not a sale. Whales may move coins to trade, to use as collateral, or just to shift wallets.
Treat it as a warning sign, not a confirmed signal.
XRP News: What Are Spot XRP ETFs Showing?
Spot ETFs for the token hold $1.53 billion in net assets. That is about 1.81% of the market cap.
As per CoinGlass data, Cumulative net inflows stand at $1.80 billion. Daily flow was a small outflow of $104.51K, and total value traded was $25.60 million (data as of Oct 15).
Fund
Sponsor
Daily Net Flow
Cumulative Net Inflow
Net Assets
Fee
Premium/Discount
XRP (NYSE)
Bitwise
-$3.75M
$684.73M
$561.05M
0.34%
+0.02%
XRPZ (NYSE)
Franklin
+$3.64M
$512.80M
$405.31M
0.19%
+0.00%
XRPC (NASDAQ)
Canary
$0
$486.81M
$329.58M
0.50%
-0.02%
TOXR (CBOE)
21Shares
$0
-$21.15M
$144.09M
0.30%
-0.20%
GXRP (NYSE)
Grayscale
$0
$145.38M
$87.87M
0.35%
-0.10%
Fees range from 0.19% to 0.50%. Most funds trade close to their net asset value, though TOXR sits at a 0.20% discount.
Long-term demand looks steady. Short-term flows look flat, with one fund losing money and another gaining almost the same amount.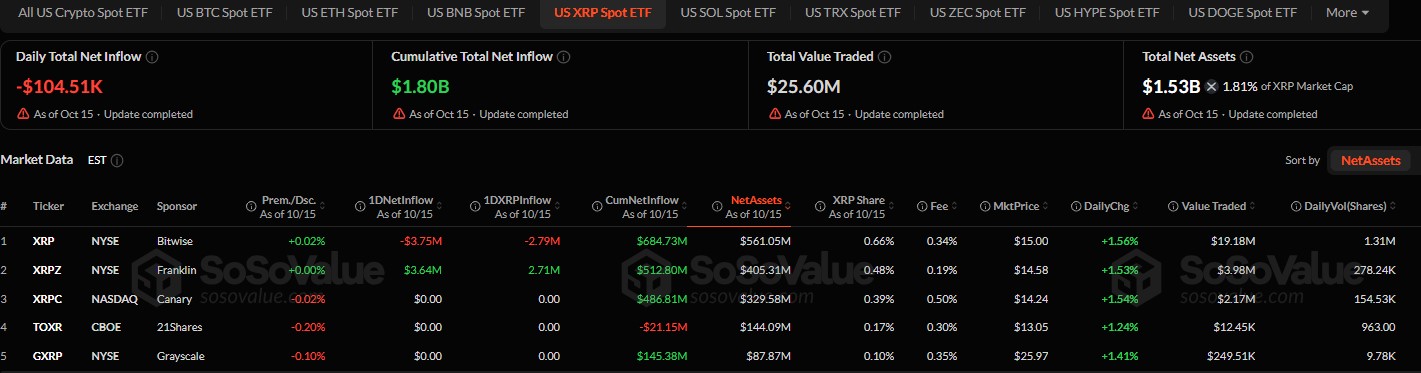
XRP Price Forecast: What Do Futures and Options Data Say?
For an XRP price forecast, derivatives data helps show trader mood. Activity cooled over the last day, and traders seem less eager to place new bets.
Metric
Value
24h Change
Futures volume
$2.42B
-33.53%
Open interest
$2.84B
-1.60%
Options volume
$4.13M
-31.24%
Options open interest
$63.83M
-5.84%
Long/short ratio (24h)
1.0547
n/a
Binance account ratio
2.6941
n/a
OKX account ratio
3.24
n/a
Top trader accounts (Binance)
3.2974
n/a
Top trader positions (Binance)
1.9724
n/a
Liquidations reached $2.98 million in 24 hours. Longs lost $1.98 million, and shorts lost $993.94K.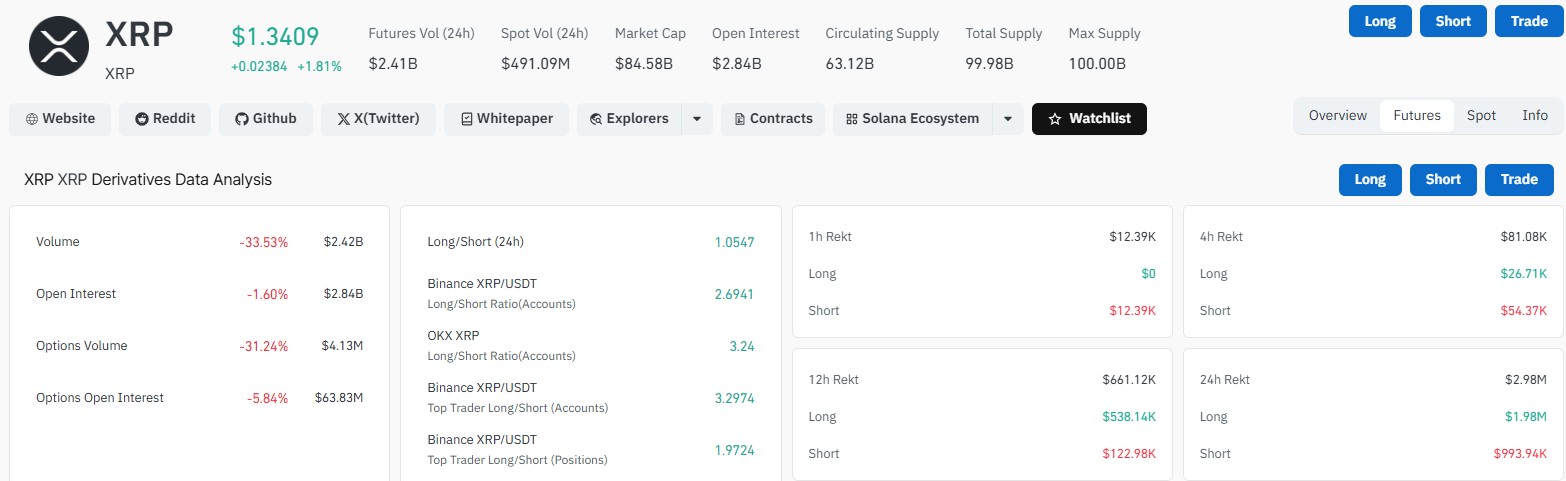
Window
Total Liquidated
Longs
Shorts
1 hour
$12.39K
$0
$12.39K
4 hours
$81.08K
$26.71K
$54.37K
12 hours
$661.12K
$538.14K
$122.98K
24 hours
$2.98M
$1.98M
$993.94K
The 12-hour window shows the pain more clearly. Longs lost $538.14K there, against $122.98K for shorts.
The overall ratio of 1.0547 is close to even. Account ratios are much higher, so many small traders lean long. Bigger positions are less one-sided.
XRP Price Analysis: Is the Daily Chart Bullish or Bearish?
On the daily chart, the price moves inside a descending channel. It keeps making lower highs and lower lows after being rejected at $1.60 to $1.65.
A sharp rally in late August lifted the price from about $1.00 to a wick near $1.70. Since then, sellers have pulled it back step by step.
The latest daily candle opened at $1.3349 and ranged from $1.3234 to $1.3457. The price is $1.3402, just above the 100 EMA and below the 20, 50, and 200 EMA.
Indicator
Value
Price Position
20 EMA
$1.4064
Below
50 EMA
$1.3890
Below
100 EMA
$1.3395
Slightly above
200 EMA
$1.3782
Below
RSI (14)
39.62
Weak momentum
RSI average line
45.92
RSI below its average
RSI near 40 shows sellers still have the edge. It is not oversold yet, so more downside is possible.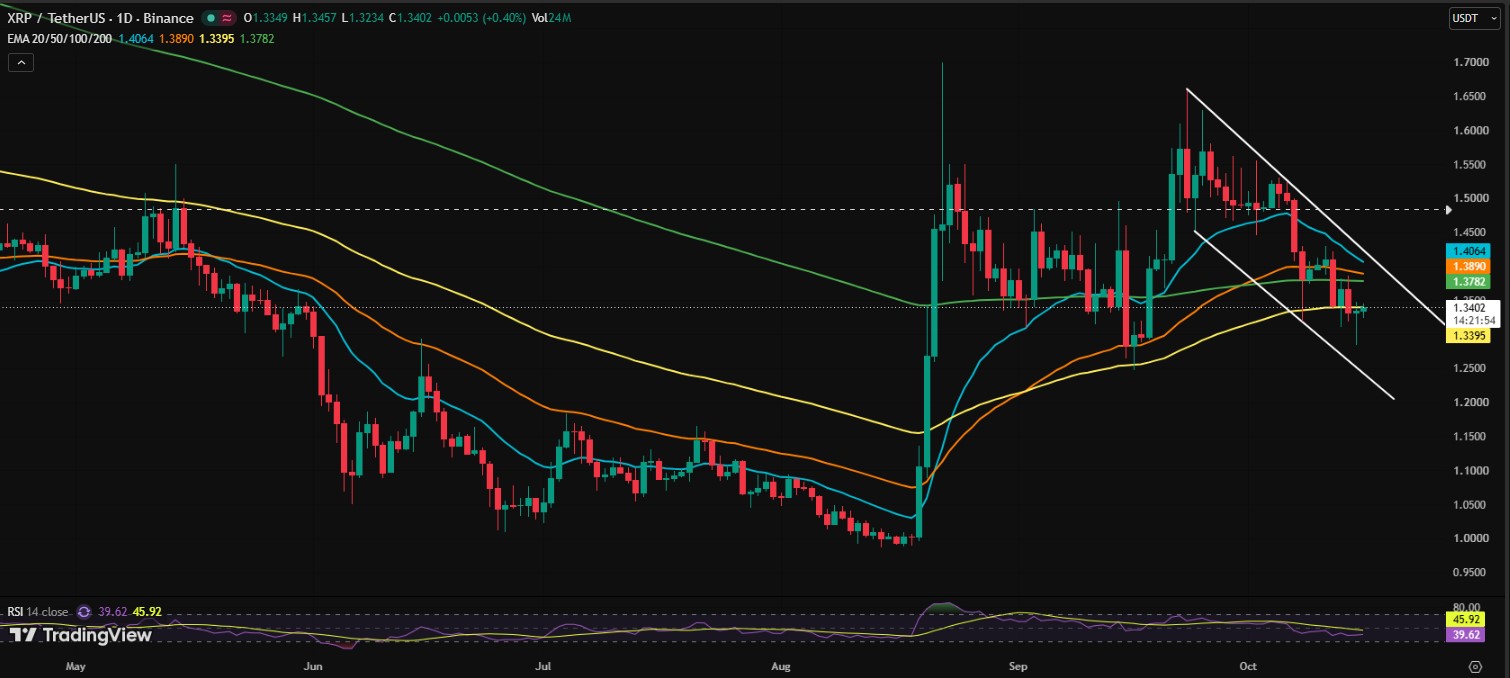
XRP Price Prediction: What Are the Key Levels to Watch?
Nothing here is certain. These are zones traders often track.
Level
Role
What to Watch
$1.20
Lower channel edge
Possible target if $1.25 breaks
$1.25
Support bulls defended
Held during the PPI selloff
$1.30 to $1.32
Near-term support
A close below $1.30 adds bearish weight
$1.38 to $1.41
Reclaim zone
Near the 20, 50, and 200 EMA
$1.45 to $1.49
Relief bounce zone
First test for buyers
$1.60 to $1.65
Major resistance
Price was rejected here before
If buyers hold support and reclaim $1.38 to $1.41, a bounce toward $1.45 to $1.49 could follow. A move above the trendline and a hold over $1.45 to $1.50 would shift the picture.
If $1.30 breaks, the price could slide toward $1.25 and then $1.20. For now, the structure stays bearish.
Watch inflation data, ETF flows, and whale moves. Any of them can change the mood fast.
Disclaimer
This article is for information only and is not financial, investment or trading advice. Crypto prices are very volatile, and you can lose some or all of your money. Price levels and views here are not guarantees. Do your own research and speak to a licensed financial advisor before you invest.
