A Structural Shift on the ASTER Chart This Aster price prediction is built around a clear structural change on the chart: after an extended period of narrow-range consolidation, ASTER has bro
A Structural Shift on the ASTER Chart
This Aster price prediction is built around a clear structural change on the chart: after an extended period of narrow-range consolidation, ASTER has broken out, and derivatives data confirms the move is not confined to spot markets.
Open interest has climbed in parallel with price, indicating that leveraged positioning is reinforcing the breakout rather than lagging behind it.
The data below sets out where ASTER stands across valuation, derivatives, technical structure, and holder distribution.
Valuation Snapshot: Market Cap, Volume and Supply
As perCoinMarketCap data, ASTER is priced at $0.6851, up 7.78% on a 24-hour basis, with market capitalization at $1.85 billion, up an equivalent 7.78%.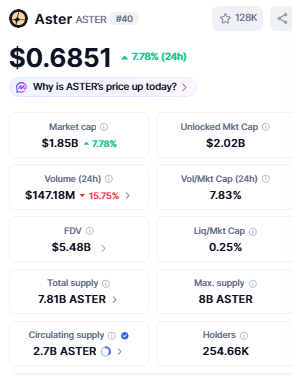
The unlocked market cap is higher, at $2.02 billion, while the fully diluted valuation stands at $5.48 billion.
Trading volume over the past 24 hours was recorded at $147.18 million, a decline of 15.75% from the prior period, translating to a volume-to-market-cap ratio of 7.83% and a liquidity-to-market-cap ratio of 0.25%. Supply-side figures show a total supply of 7.81 billion tokens against a maximum cap of 8 billion, with 2.7 billion tokens in circulation held by 254,660 wallets.
Derivatives Read: Positioning, Liquidations and Turnover
According toCoinglass data, price performance stands at +1.62% over 4 hours, +7.48% over 24 hours, +14.21% over 7 days, +8.59% over 30 days, -1.02% over 90 days, -1.70% over 180 days, -1.11% year-to-date, and +599.77% over the trailing year and since inception.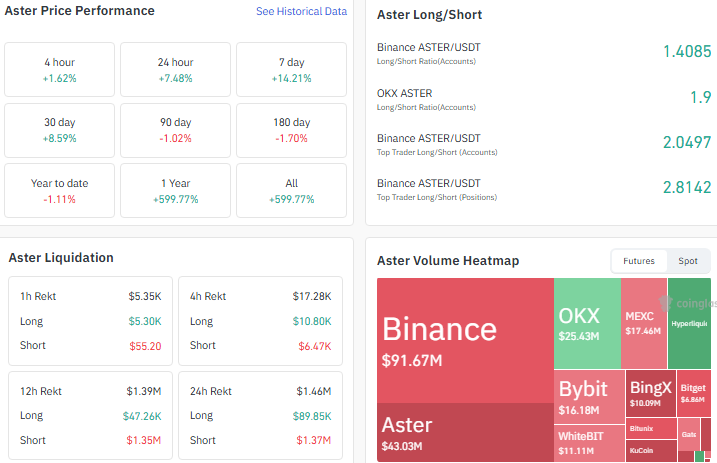
Futures turnover is led by Binance at $91.67 million, followed by ASTER's own exchange at $43.03 million, OKX at $25.43 million, MEXC at $17.46 million, and Bybit at $16.18 million.
Liquidation over 24 hours shows $1.46 million wiped out, weighted heavily toward short positions at $1.37 million against $89.85K in longs, a pattern that also holds over the 12-hour window.
Long/short positioning skews bullish: the Binance account ratio reads 1.41, OKX shows 1.9, and Binance's top-trader position ratio runs as high as 2.81, indicating that larger accounts carry a meaningfully longer bias than the retail base.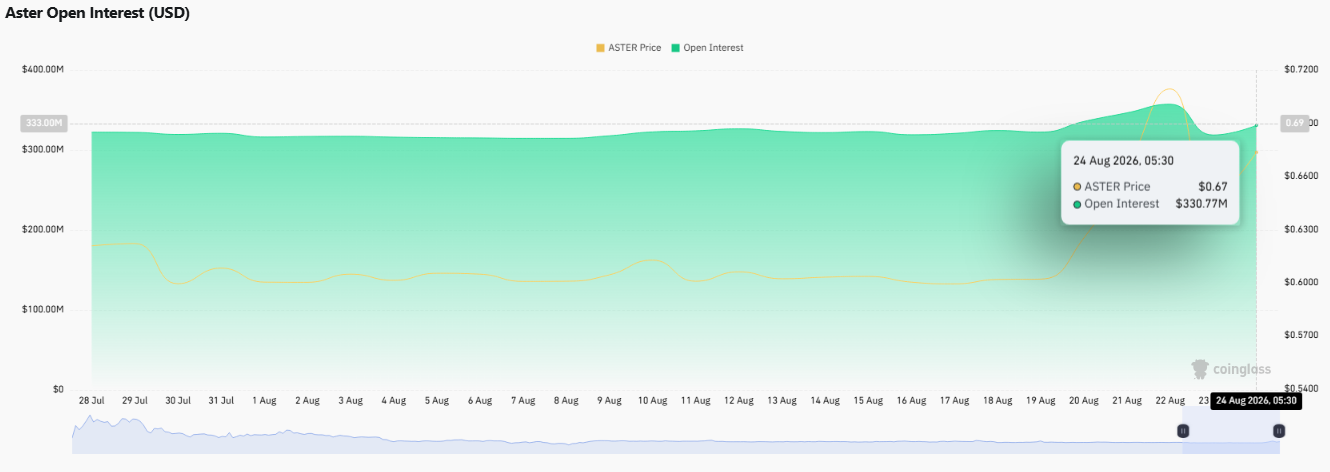
Open interest was recorded at $330.77 million as of 05:30 UTC on 24 August, against a price of $0.67 at that timestamp.
Technical Structure: Trendline, Resistance and RSI
$ASTER's price structure shows an extended consolidation phase giving way to a breakout defined by a clean ascending trendline, which has held on each retest.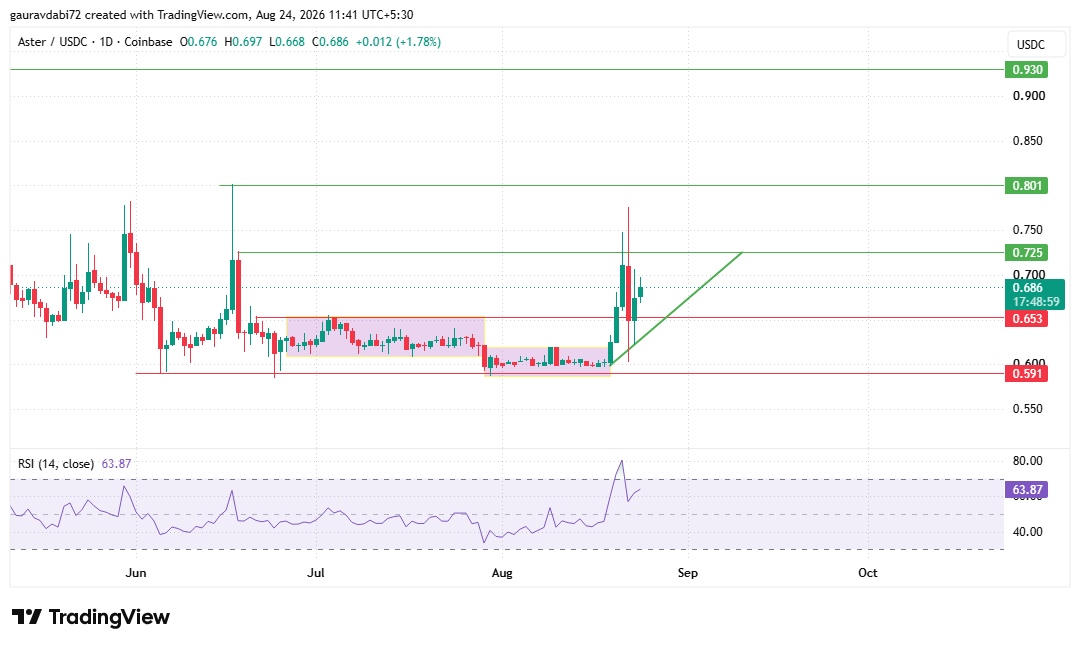
Three consecutive large-bodied green candles were followed by a single red candle consistent with short-term profit taking rather than a reversal, since price held at trendline support and resumed higher.
Data from the TradingView chart for ASTER/USDC shows this. The 14-period RSI reads 63.87, placing momentum in bullish territory but short of the overbought threshold.
The immediate structural level for this Aster price prediction is $0.725. A close above it, sustained rather than a wick, would target $0.801 and, beyond that, $0.930.
Failure to close above $0.725 points to a consolidation range between $0.653 and $0.725. A breakdown scenario would bring $0.653 and, further out, $0.591 into focus as support.
Scenario Matrix: Bullish, Neutral and Bearish Paths
The table below summarizes the three scenarios relevant to this Aster price prediction, based on the levels identified above:
Scenario
Trigger Condition
Levels in Focus
Bullish
A close above $0.725 on sustained volume, confirming resistance turned support.
Targets at $0.801 and $0.930.
Neutral / Range-bound
Price fails to close decisively above $0.725 and consolidates instead.
Range of $0.653 to $0.725.
Bearish
A break of the ascending trendline and loss of $0.653 support.
Support at $0.653, then $0.591.
Distribution Data: Concentration Across ASTER Wallets
On-chain wallet distribution data indicates a high degree of concentration in $ASTER's holder base.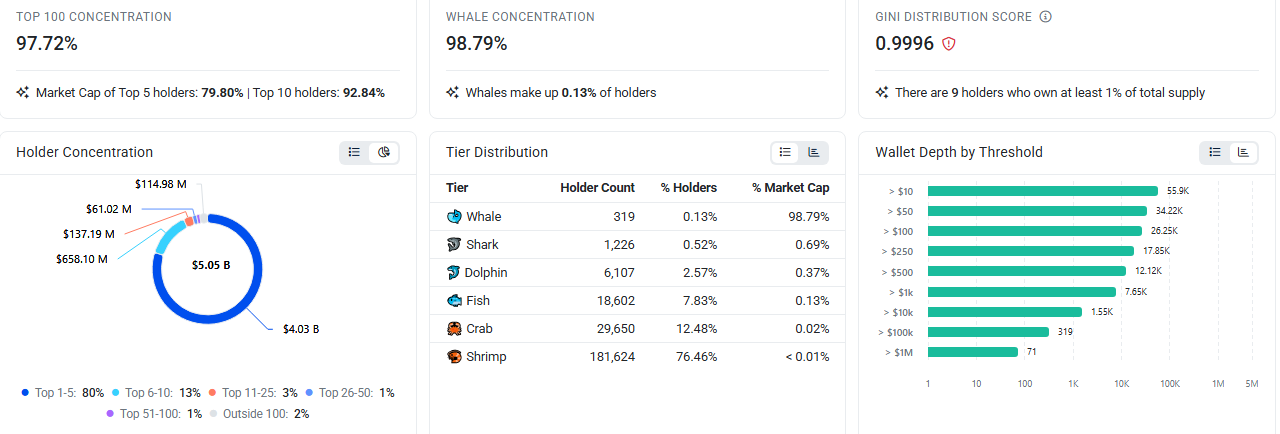
The top 100 wallets account for 97.72% of supply, with the top 5 holders alone controlling 79.80% and the top 10 controlling 92.84%.
Whale wallets represent just 0.13% of total holders yet hold 98.79% of value, and the Gini distribution score is recorded at 0.9996, with 9 wallets each holding at least 1% of total supply.
Tier-level data shows 319 whale wallets accounting for 98.79% of value, while the shark, dolphin, fish, crab, and shrimp tiers, collectively over 235,000 wallets, hold barely more than 1% combined.
Wallet-depth figures show 55,900 wallets holding at least $10 in $ASTER, against only 71 wallets holding positions above $1 million.
Summary Assessment
As per the CoinGabbar analyst, the Aster price prediction points to a token in the early stages of a breakout, supported by rising open interest and long-skewed derivatives positioning.
The unresolved variable is whether $0.725 gives way; until it does, a range-bound outcome remains equally plausible.
Holder concentration data further indicates that price can move sharply on large-wallet activity.
Disclaimer: This article is intended purely as market analysis based on publicly available price, derivatives, and on-chain data and should not be read as investment advice. Readers are encouraged to do their own research before making any decisions.