What Does DSNT's Chart Actually Reveal Right Now? DSNT trades at $0.000977, down 4.42% today, but the daily percentage hides a session shaped by three distinct plateaus rather than one contin
What Does DSNT's Chart Actually Reveal Right Now?
DSNT trades at $0.000977, down 4.42% today, but the daily percentage hides a session shaped by three distinct plateaus rather than one continuous move.
This DeepSnitch AI Price Prediction breaks down that pattern step by step, checks it against 52-week range data, and builds two price-prediction tables from what's actually verifiable.
DSNT Snapshot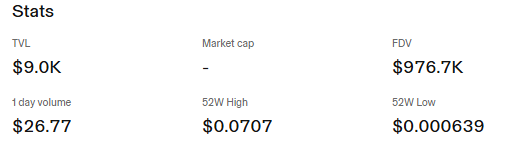
Source: DSNT live price dashboard by Uniswap, captured August 12, 2026
Metric
Value
Current Price
$0.000977, down 4.42% (24H)
Market Cap
Not available (unreported circulating supply)
FDV
$976.7K
TVL
$9.0K
1-Day-Volume
$26.77
52-Week High
$0.0707
52-Week Low
$0.000639
The Chart Secret: A Three-Step Session, Not a Single Trend
The 1D chart shows price starting near $0.00108 in early morning, dropping sharply to roughly $0.000920 by mid-morning, then jumping back up to hold a flat $0.00107-$0.00108 plateau for the bulk of the day.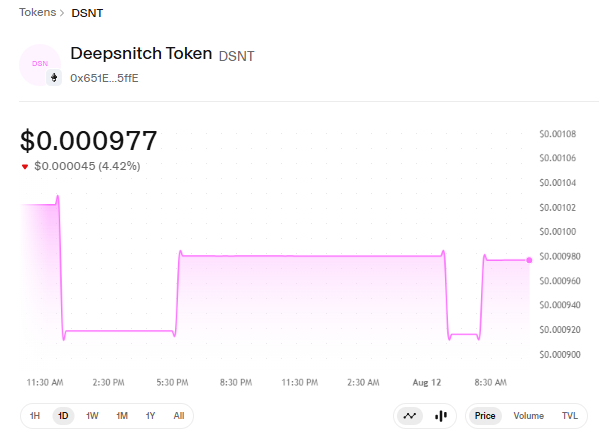
Source: DSNT Live Chart dashboard by Uniswap, captured August 12, 2026
Late in the session, the price drops again to around $0.00093 briefly before recovering to today's closing level of $0.000977.
This is not a clean directional move in either direction; it's a token bouncing between two narrow price bands multiple times within a single day.
Why the Pattern Matters More Than Today's Percentage
A 4.42% daily decline understates what actually happened intraday; the price moved through at least four distinct level changes in one session.
At just $26.77 in daily volume, this kind of repeated back-and-forth is consistent with extremely thin liquidity, where a handful of small trades can push price between levels multiple times without reflecting broader market conviction in either direction.
Does This Support a DSNT Listing Narrative?
No confirmed exchange listing exists for DSNT as of this update. Volume this low, $26.77, does not independently signal any approaching announcement; it reflects a token with minimal current trading interest regardless of what the chart's shape suggests.
DeepSnitch AI Price Prediction: Methodology
DSNT's available chart contains no drawn support or resistance levels.
This DSNT price prediction is built from the 52-week price range ($0.000639-$0.0707), todays-volume conditions ($26.77 against a $976.7K FDV), and the specific multi-step pattern observed in this session.
No listing catalyst or tokenomics disclosure was available to factor in separately.
DeepSnitch AI Price Prediction: Near-Term Scenario Table
Scenario
Estimated Price Range
Key Assumption
Bear Case
$0.000639-$0.00082
Continued thin volume, staircase pattern resumes downward, test toward 52-week low
Base Case
$0.00092-$0.00105
Price settles within today's observed range; volume stays near current thin levels
Bull Case
$0.00115-$0.00135
Volume increases meaningfully, price breaks above today's plateau ceiling with sustained buying
DeepSnitch AI Price Prediction: Extended Outlook Scenario Table
Scenario
Estimated Price Range
Key Assumption
Bear Case
$0.0005-$0.00060
52-week low breaks decisively; volume remains under $30/day for multiple weeks
Base Case
$0.0011-$0.0018
Gradual stabilization: volume improves modestly from current levels over several sessions
Bull Case
$0.003-$0.006
Sustained volume-increase over multiple weeks, renewed interest confirmed by consistent trading activity beyond single-session spikes
Numbers Behind These Ranges
The near-term bear case reflects a continuation toward the 52-week low ($0.000639), roughly 35% below the current price.
The near-term bull case ($0.00115-$0.00135) represents a 18-38% move above today's close, staying within the bounds of today's own observed volatility rather than extrapolating toward the much higher 52-week high of $0.0707.
Risks Worth Naming
The clearest risk is that today's multi-step price pattern, at just $26.77 in volume, likely reflects a small number of trades rather than genuine market conviction; none of the price prediction ranges above should be read as high-confidence forecasts given this liquidity level.
Market cap remains unavailable due to unreported circulating supply. No DeepSnitch AI listing has been officially confirmed on any exchange as of this update.
Extended-outlook figures carry substantially wider uncertainty than the near-term table, given how few confirmed variables exist beyond current chart and volume-data.
Glossary
Multi-Step Pattern:A price chart showing several distinct plateau-and-jump movements within a single session, often indicating thin liquidity rather than a sustained trend.
TVL (Total Value Locked):The dollar value of assets currently deposited in a project's protocol or liquidity pool; DSNT's is $9.0K.
FDV (Fully Diluted Valuation): A token's theoretical market cap if its entire max supply were in circulation at the current price.
Disclaimer
Informational purposes only, not financial advice. DSNT's available chart contains no drawn technical support or resistance levels; price prediction ranges above, across both tables, are analyst estimates based on 52-week range and volume-pattern data, not confirmed technical levels or a listing announcement. DSNT trades in a low-liquidity environment. Verify all data independently before making any decisions.