BitcoinWorld AUD/JPY Price Forecast: Pair Eases Near 114.00, Bullish Structure Remains Intact Above Key Moving Average The AUD/JPY currency pair has eased slightly to trade near the 114.00 le
BitcoinWorld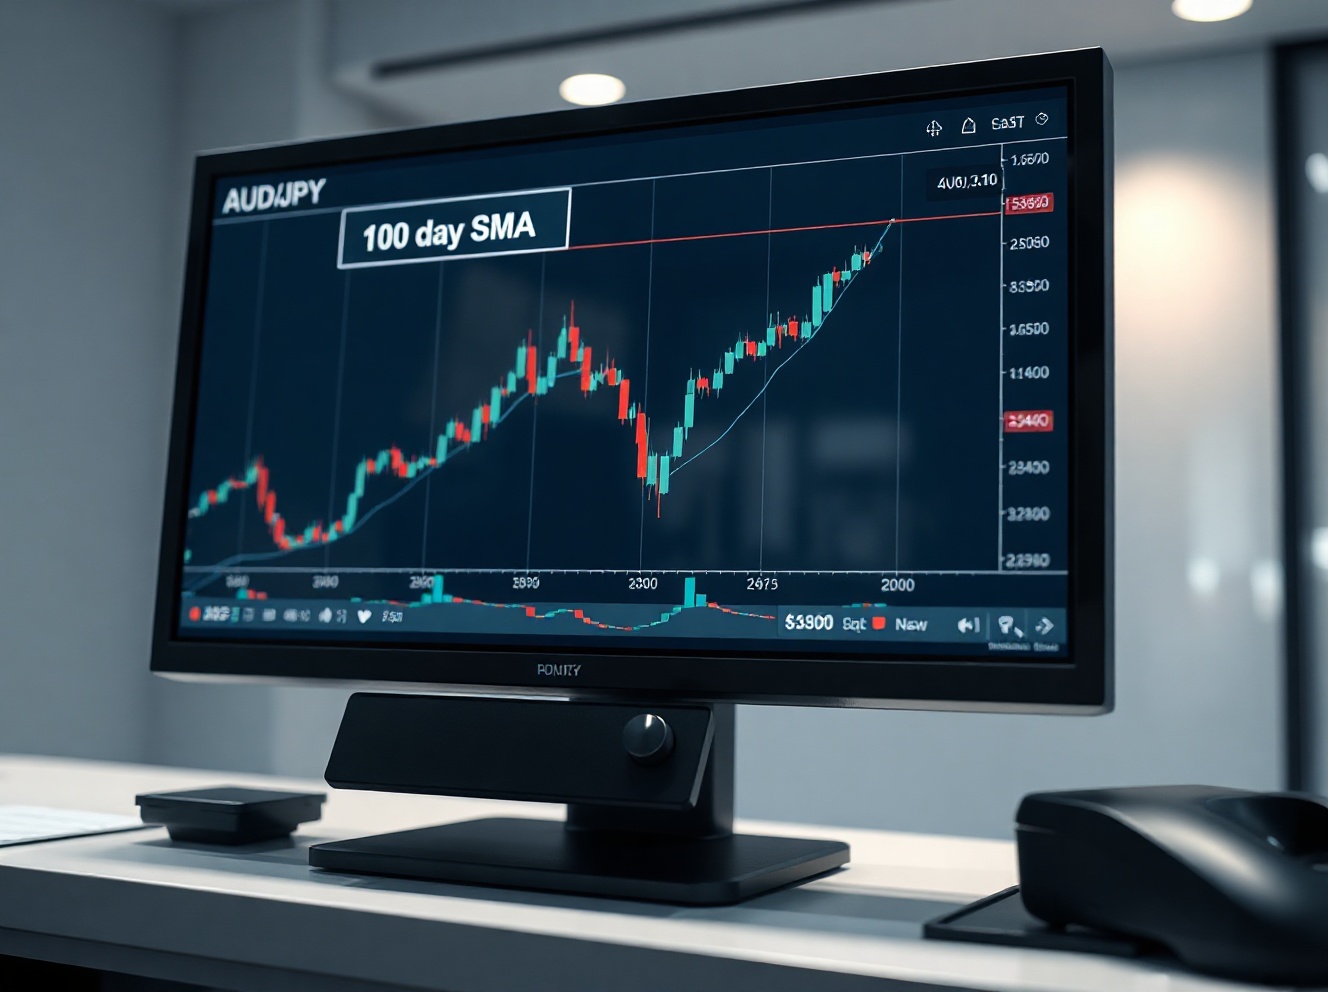 AUD/JPY Price Forecast: Pair Eases Near 114.00, Bullish Structure Remains Intact Above Key Moving Average
The AUD/JPY currency pair has eased slightly to trade near the 114.00 level during Tuesday’s Asian session, yet the broader technical structure remains supportive of a bullish bias as long as prices hold above the 100-day Simple Moving Average (SMA).
Technical Overview: Key Levels in Focus
The pair has pulled back from recent highs, reflecting a mild correction within an otherwise constructive uptrend. The 100-day SMA, currently situated around the 113.50 region, continues to act as a critical floor for the near-term outlook. A sustained hold above this moving average would keep the bullish narrative intact, with the next upside targets likely emerging near the 114.50 and 115.00 resistance zones.
On the downside, a break below the 100-day SMA could expose the 113.00 support level, followed by the 112.50 area. However, momentum indicators such as the Relative Strength Index (RSI) remain in neutral territory, suggesting the current pullback is not yet signaling a broader trend reversal.
Market Context and Drivers
The Australian dollar has been influenced by a mixed set of factors. Firm commodity prices, particularly iron ore and coal, have provided underlying support for the Aussie. Meanwhile, the Japanese yen continues to face headwinds from the Bank of Japan’s persistently accommodative monetary policy stance, which keeps yield differentials favoring the Australian dollar.
Investors are also watching for any shifts in risk sentiment, as the AUD/JPY pair is highly sensitive to global equity market performance. A sustained risk-on mood tends to benefit the Australian dollar against the yen, while risk aversion often drives the pair lower.
What This Means for Traders
For short-term traders, the 100-day SMA offers a clear technical reference point. A bounce from this level could present a buying opportunity with a stop-loss placed just below the moving average. Conversely, a decisive breakdown below the SMA would shift the bias to neutral or bearish, opening the door for short positions targeting lower supports.
Medium-term holders should watch for a close above 114.50 to confirm renewed bullish momentum, which could pave the way for a test of the 115.00 handle and beyond.
Conclusion
The AUD/JPY pair is experiencing a modest pullback, but the underlying technical structure remains positive as long as the 100-day SMA holds. The coming sessions will be crucial in determining whether the current correction is a healthy consolidation within an uptrend or the beginning of a deeper decline. Traders should monitor the 113.50–114.00 zone closely for directional cues.
FAQs
Q1: Why is the 100-day SMA important for AUD/JPY?The 100-day SMA is a widely followed technical indicator that helps traders identify the medium-term trend. A price holding above this moving average generally suggests the uptrend is intact, while a break below can signal a potential trend reversal.
Q2: What factors are currently driving the AUD/JPY pair?The pair is influenced by commodity prices (especially iron ore and coal), the Bank of Japan’s monetary policy, global risk sentiment, and interest rate differentials between Australia and Japan.
Q3: What are the next key resistance and support levels for AUD/JPY?Immediate resistance is near 114.50, followed by 115.00. On the downside, key support lies at the 100-day SMA around 113.50, with further support at 113.00 and 112.50.
This post AUD/JPY Price Forecast: Pair Eases Near 114.00, Bullish Structure Remains Intact Above Key Moving Average first appeared on BitcoinWorld.