BEAT is in freefall, and traders are scrambling to figure out where the bleeding stops. This Audiera price prediction lands right as panic selling grips the chart, with the price breaking bel
BEAT is in freefall, and traders are scrambling to figure out where the bleeding stops.
This Audiera price prediction lands right as panic selling grips the chart, with the price breaking below the trendline that had held for weeks and a bearish EMA crossover confirming the shift in momentum.
Over the next few days, the bearish case stays in control as long as BEAT trades below $1.3984, and only a reclaim of that zone would flip the picture back toward recovery.
With liquidations piling up and volume spiking, here's what the chart and derivatives data actually show.
Market data was checked on August 11, 2026, at 11:03 IST.
Audiera Price Prediction Today: Market Overview
Metric
Value
Price
$1.3124
24h Change
-50%
Market Cap
$441.75M
FDV
$1.39B
24h Volume
$142.7M
Vol/Mkt Cap (24h)
30.96%
Liquidity/Mkt Cap
0.59%
Total Supply
1B BEAT
Max Supply
1B $BEAT
Circulating Supply
330.51M $BEAT
Source: Data from CoinMarketCap as of August 11, 2026, at 11:03 IST.
Figures may vary slightly across other tracking websites.
Audiera Liquidation and Volume Data
This section covers futures market data from Coinglass, kept separate from the spot volume figures above.
Liquidations (Long vs. Short)
Timeframe
Total
Long
Short
1h
$10.35K
$5.98K
$4.37K
4h
$192.66K
$121.07K
$71.59K
12h
$1.77M
$1.29M
$486.62K
24h
$3.30M
$2.37M
$936.45K
Long positions have taken the bulk of the damage across every timeframe, which lines up with a market that kept buying dips on the way down and kept getting stopped out.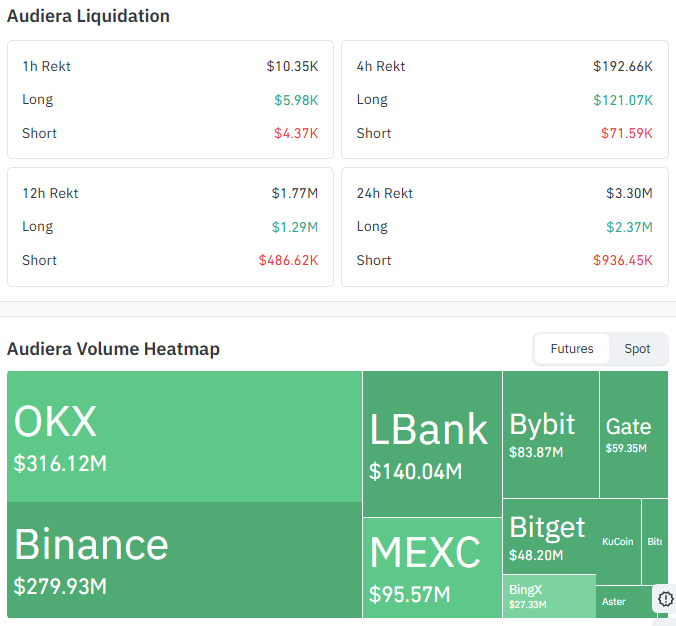
Source: Data From CoinGlass
Futures Volume by Exchange
Exchange
Volume
OKX
$316.12M
Binance
$279.93M
LBank
$140.04M
MEXC
$95.57M
Bybit
$83.87M
Gate
$59.35M
OKX and Binance are handling the bulk of futures activity, which is typical for a token this size during a high-volatility move.
Audiera Price Prediction: Audiera Holder Concentration
On-chain data shows BEAT supply is heavily concentrated.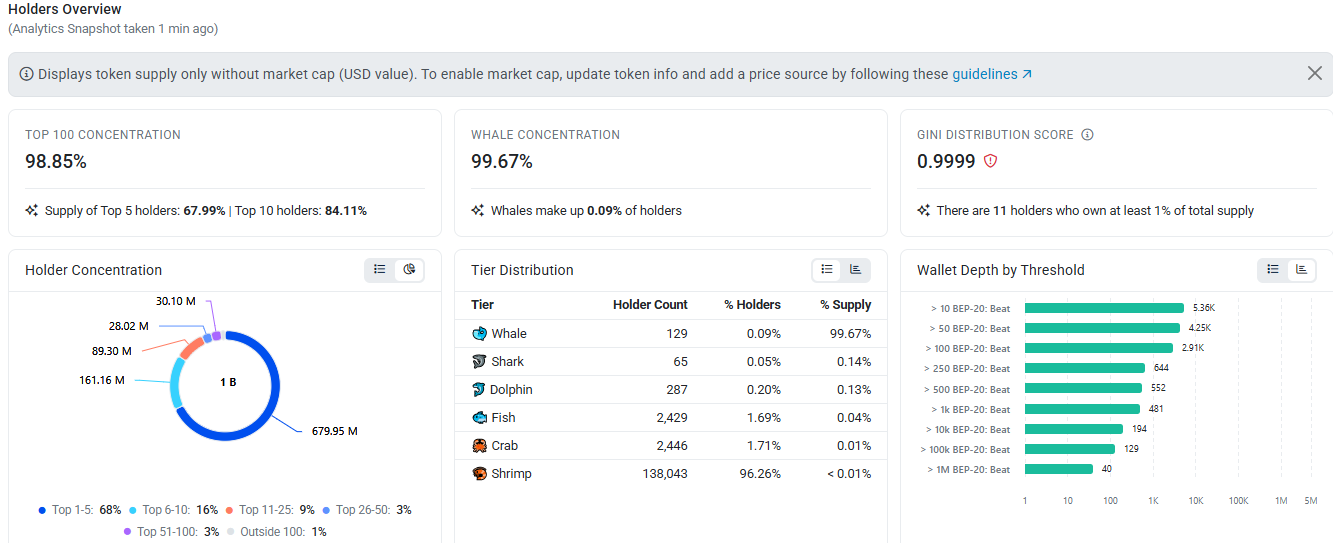
The top 100 wallets hold 98.85% of total supply, with whale wallets alone accounting for 99.67% of supply despite making up just 0.09% of all holders.
Just the top 5 holders control 67.99% of supply, and the top 10 control 84.11%. The Gini Distribution Score sits at 0.9999, close to maximum inequality, with 11 wallets each holding at least 1% of the total supply.
This kind of concentration means a small group of large holders can move the market significantly if they decide to sell, which adds another layer of risk on top of the technical picture.
Audiera Price Crash: Why is BEAT Price Falling?
BEAT's drop looks like a fairly standard case of heavy selling pressure meeting thin near-term demand rather than one single trigger.
Long liquidations dominating every timeframe above suggest leveraged buyers kept trying to catch the falling price and kept getting flushed out, which tends to accelerate a decline rather than slow it.
Rising volume alongside the drop points to active distribution, meaning holders are actively exiting positions rather than the token simply drifting lower on light trading.
This kind of move often feeds on itself: falling price triggers stop-losses and liquidations, which adds more sell pressure, which pushes price down further until buyers eventually step back in at lower levels.
Audiera Price Prediction Chart: Technical Analysis
Pair: BEAT/USDT · Market: Spot (Crypto) · Exchange: TradingView Crypto Index · Timeframe: 1H · Source: TradingView · Timestamp: August 11, 2026, 11:03 UTC+5:30
BEAT is trading at $1.3124, after breaking below the ascending trendline that had supported the price since the recent rally began.
The break was sharp, with the price sliding from highs near $3.800 down toward the current level in a matter of hours.
A bearish EMA crossover is marked on the chart where the EMA 20 crossed below the EMA 50, confirming the shift from an uptrend to a downtrend.
Both EMAs remain well above the current price, with the EMA 20 at $1.7845 and the EMA 50 at $2.2551, acting as distant overhead resistance that would need a strong recovery to even test.
RSI (Relative Strength Index, a momentum gauge from 0 to 100) is reading 26.40, in oversold territory, which sometimes points to a short-term bounce even within a larger downtrend.
Price is consolidating in a small range. If it breaks the current support level of $1.2331, we could see more downside.
The trend stays bearish until the price trades back above the EMAs with strong volume, if price does move up before that happens, it should be treated as a pullback rather than a trend change. 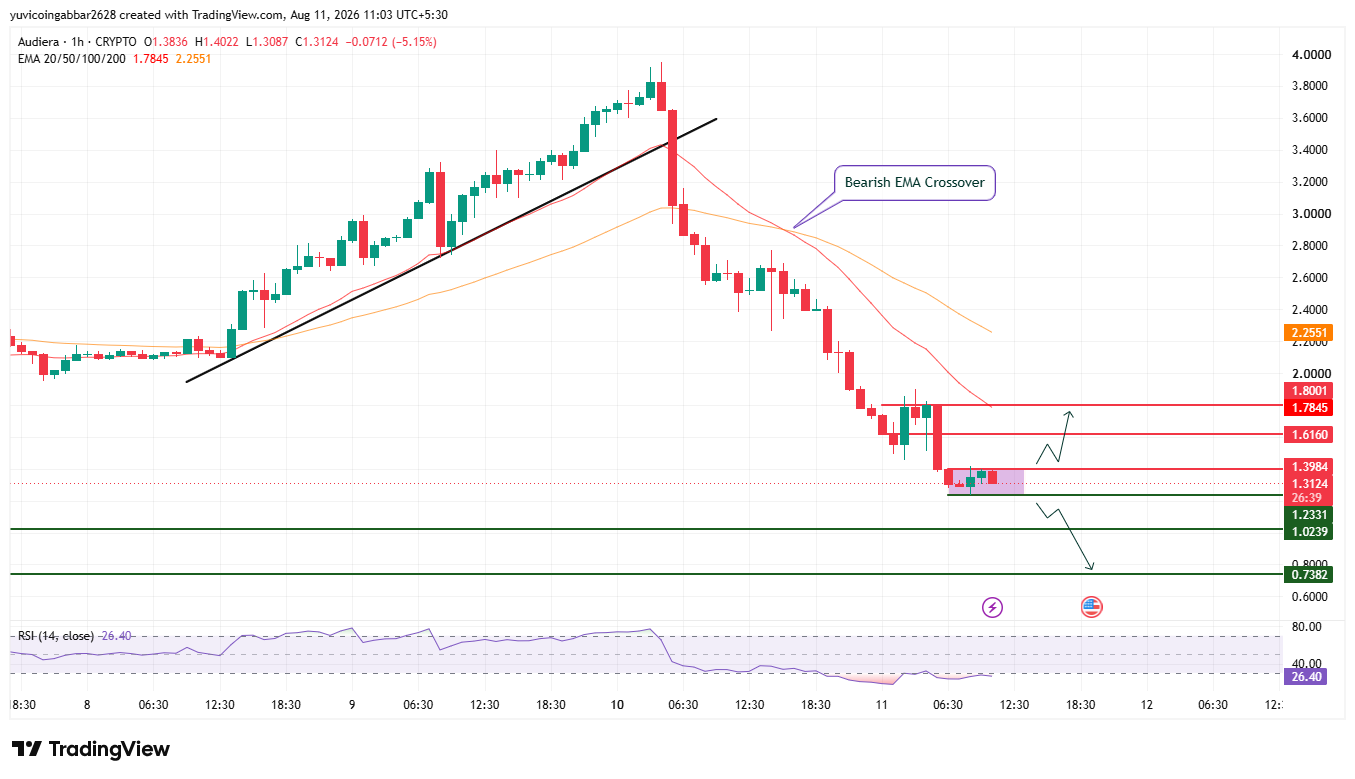
Support and Resistance Levels
Level Type
Price
Resistance 3
$1.8001
Resistance 2
$1.6160
Resistance 1 (nearest)
$1.3984
Immediate Price Reference
$1.3124
First Confirmed Support
$1.2331
Deeper Support
$1.0239
Structural Floor
$0.7382
EMA Levels
EMA
Price
EMA 20
$1.7845
EMA 50
$2.2551
Audiera Forecast: Bull Case vs. Bear Case
BEAT price target 2026 Bull case: Holding above $1.2331 and stabilizing here would suggest the sharpest part of the sell-off is done.
A bounce that clears the nearest resistance at $1.3984 would open the path toward $1.6160, though reclaiming the EMA cluster near $1.7845 to $2.2551 would be needed to fully break the bearish crossover.
BEAT price target 2026 Bear case: A break below $1.2331 would confirm sellers are still in control and put $1.0239 in play.
Losing $1.0239 would expose the structural floor at $0.7382 as the next downside level.
BEAT price target: Can BEAT reach $1.8001?
$1.8001 is the highest resistance level marked on the chart. Reaching it would require BEAT to first hold above $1.2331, clear the nearest resistance at $1.3984 and then push through $1.6160, all while working against the EMA 20 sitting right in that zone at $1.7845.
That's a steep, multi-stage recovery rather than a quick move, especially with the EMA 50.
What Could Invalidate the Bullish Setup?
A failed bounce at $1.3984 followed by a close back below $1.2331 would keep the bearish structure fully intact.
A deeper break through $1.0239 down to the $0.7382 structural floor would confirm the trendline breakdown has further run and would likely need buyers to step in aggressively to prevent.
Audiera Price Prediction 2026: Expert View
According to CoinGabbar analysts, the trendline break and bearish EMA crossover both point the same direction right now, and the scale of long liquidations across every timeframe shows just how caught off guard leveraged buyers were.
An RSI near 26 does raise the odds of a short-term relief bounce, but that's different from a trend reversal.
The $1.2331 to $1.3984 zone is the one to watch over the next day or two: holding it would suggest selling is drying up, while losing it keeps the door open toward $1.0239 and below.
Audiera Price Prediction: Data Sources
Price, EMA, and RSI data referenced from a 1H BEAT/USDT chart via TradingView, timestamped August 11, 2026, 11:03 UTC+5:30.
Market cap, FDV, volume, and supply data referenced from a crypto market tracker (CoinMarketCap/CoinGecko-style source).
Liquidation and futures volume data referenced from Coinglass.
Disclaimer: This piece is for informational purposes only and isn't financial advice. The levels and scenarios above are based on technical chart analysis and publicly available data at the time of writing, and crypto markets can move sharply within hours, so past patterns don't guarantee future outcomes. It's worth doing independent research and considering your own risk tolerance before acting on any of the levels discussed here.