Ava, the native token of Travala.com, powers one of the more established travel-booking platforms built on crypto payments, letting users book flights, hotels, and travel packages using digit
Ava, the native token of Travala.com, powers one of the more established travel-booking platforms built on crypto payments, letting users book flights, hotels, and travel packages using digital assets.
It's carved out a steady niche in the real-world-utility corner of the market, away from the purely speculative side of crypto.
Right now AVA is priced at $0.1824, down close to 7% over the past day.
This AVA price prediction starts from that level, working through the 4H and 1D chart structures to frame what a short-term move might look like from here.
Live Market Data
MetricValue
Current Price$0.1824
24h Change-6.6%
24h High/Low$0.1969 / $0.1813
Market Cap$13.562M
Fully Diluted Valuation$13.562M
24h Trading Volume$8.331M
Circulating Supply74.374M AVA
Max Supply100M AVA
Source: $AVA market cap data taken from Coingecko, data as of Aug 13, 2026. Figures may vary slightly across other tracking websites.
Key Takeaways
Forecast window: short-term, next 24–48 hours, based on 4h and 1d chart structure.
AVA's trading at $0.1824 right now, down 6.6% on the day. The pullback's brought price right into a zone both charts are watching closely.
On the 4-hour chart, AVA just came out of a descending channel and is testing support near $0.1772.
The daily chart shows something similar happening at a bigger scale, with the price sitting right under a longer-term descending trendline.
A bounce and reclaim of $0.2006–$0.2163 on the 4h would support a move toward $0.2231, then $0.2525 on the daily. This fails if the price closes back below $0.1772.
Lose the $0.1772 support instead, and AVA risks a slide toward $0.1642, with $0.1470 as the deeper daily level if the trendline keeps holding as resistance.
Technical Analysis
4-Hour Chart: Testing Support After a Descending Channel
The price on the 4-hour chart (Binance, AVA/USDT) recently moved out of a descending channel and is now going to test the support level around $0.1772. 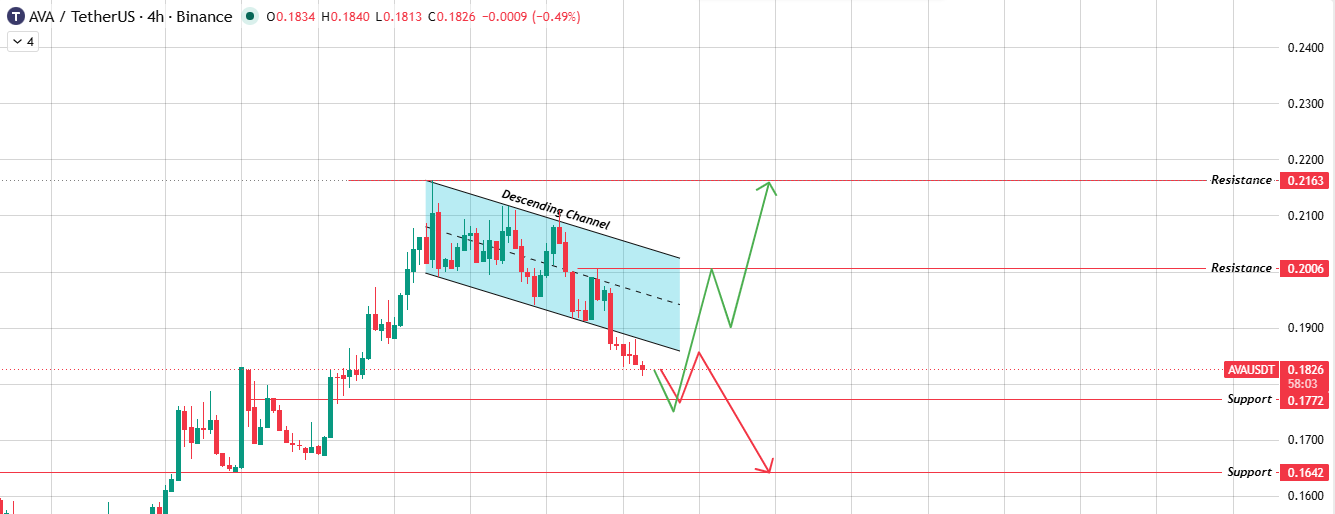
Source: Chart Taken From TradingView.
This is the level that matters most right now. Hold it, and a bounce toward $0.2006 looks likely, with $0.2163 as the next resistance if buyers keep control.
Lose it instead, and $0.1642 becomes the first real support below, opening more room to the downside if selling continues.
1-Day Chart: Price Still Under A Longer-Term Trendline
Zoom out to the daily, and $AVA remains under a descending trendline that's been capping every rally since the recent high. 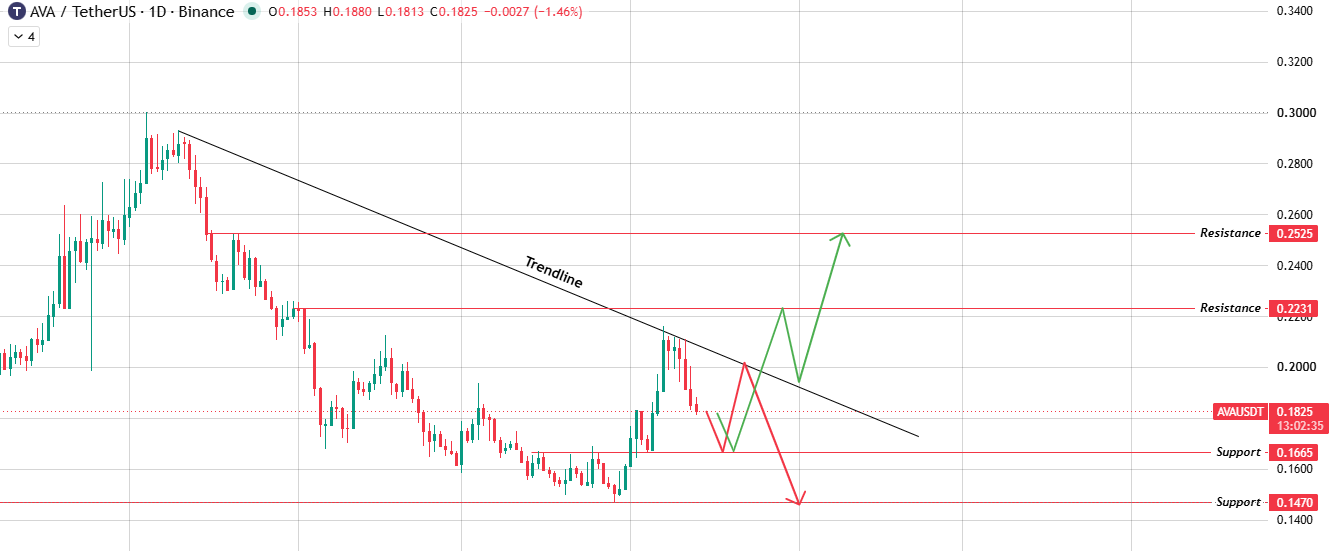
Source: Chart Taken From TradingView.
Price is currently hovering just above support near $0.1665, with $0.1470 as deeper daily support if this level fails.
A break above the trendline and resistance at $0.2231 would open the door toward $0.2525, but that's a bigger move and would need sustained buying to confirm.
Both timeframes are pointing at the same zone right now; the $0.1665–$0.1772 range is doing the heavy lifting for AVA's short-term direction.
Bull, Base & Bear Case
ScenarioOutlookInvalidation
Bull Case$AVA holds $0.1772 support and reclaims the descending channel, pushing toward $0.2006, then $0.2163 and $0.2231 on the daily.The price closes back below $0.1772.
Base Case$AVA keeps chopping between $0.1772 support and the descending trendline resistance while the structure resolves.A confirmed daily close outside either boundary.
Bear CaseBreakdown through $0.1772 drags price toward $0.1642, with $0.1470 as the deeper daily support if the trendline caps every bounce.Price reclaims $0.2006 on a sustained basis.
Glossary
A descending channel is a price structure that falls between two parallel, downward-sloping trendlines.
A descending trendline connects a series of lower highs and typically acts as resistance until broken.
Support is a price zone where buying pressure has repeatedly stepped in to halt declines.
Resistance is a price zone where selling pressure has historically capped rallies.
Circulating supply refers to the number of tokens currently available and actively trading in the market.
Methodology
This AVA price prediction draws from 4h and 1d AVA/USDT chart analysis on Binance, captured 13 Aug 2026, combined with live market data from CoinGecko.
All price levels referenced come directly from the charts provided, with nothing extrapolated beyond what's visible.
This forecast should be revisited if AVA closes decisively outside the $0.1642–$0.2231 range.
Disclaimer: This article is for informational purposes only and should not be treated as financial or investment advice. Cryptocurrency markets are highly volatile, and price predictions carry no guarantee of accuracy. Readers should conduct independent research before making investment decisions.