Avalanche has spent weeks grinding sideways after a sharp pullback, and AVAX is now sitting right at the edge of its consolidation range with a "fake breakdown" level just below the current p
Avalanche has spent weeks grinding sideways after a sharp pullback, and AVAX is now sitting right at the edge of its consolidation range with a "fake breakdown" level just below the current price.
Avalanche is a Layer 1 blockchain known for fast finality and customizable subnets, used across DeFi and enterprise blockchain deployments, including partnerships with FIFA and Hyundai.
This Avalanche price prediction august 2026 looks at what's next for the AVAX price today. Here's the full breakdown.
Avalanche AVAX Market Overview
Metric
Value
Price
$6.4169
24h Change
−0.45%
Market Cap
$2.76B (−0.45%)
24h Volume
$242.62M (−3.5%)
Vol/Mkt Cap (24h)
8.76%
FDV
$4.58B
Total Supply
463.44M AVAX
Max Supply
715.74M AVAX
Circulating Supply
431.77M AVAX
Holders
181.25K
Profile Score
79%
Source: Data from CoinMarketCap as of 29/07/2026. Figures may vary slightly across other tracking websites.
Avalanche news: Helicon Upgrade Goes Live on Fuji Testnet
The Avalanche Foundation announced that its Helicon upgrade has been activated on the Fuji testnet, bringing continuous execution to the C-Chain along with changes to Avalanche's staking economics. 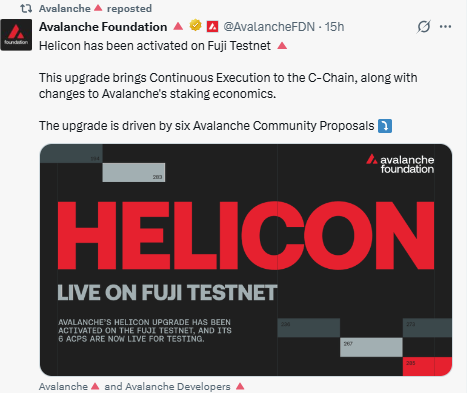
The upgrade is driven by six Avalanche Community Proposals (ACPs) and is currently in testnet-stage testing rather than live on mainnet, so any staking-economics changes are not yet in effect for AVAX holders.
AVAX Staking Data From Bitwise
Bitwise's quarterly staking report, reposted by Avalanche, shows 41.5% of all AVAX currently staked, with stakers paid in newly minted AVAX while every transaction fee is burned.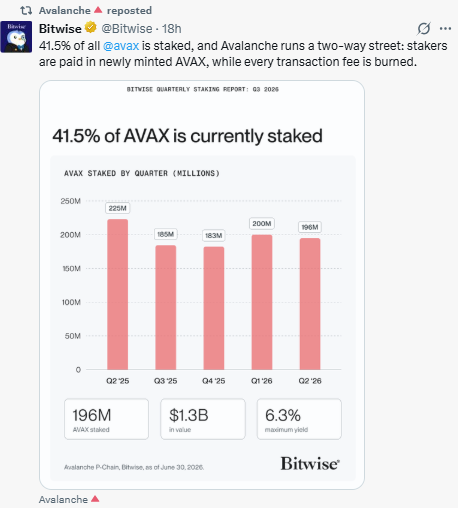
As of the report, 196M AVAX (about $1.3B) was staked with a maximum yield of 6.3%, following a range of 183M–225M AVAX staked per quarter since Q2 2025, a relatively stable staking participation rate over the past year.
AVAX Network and Holder Data
Avalanche Token Unlock Allocation
As of July 29, 2026, Team holds the largest single-entity allocation at 20.00%, followed by Foundation at 18.52%, Strategic Partners at 10.00%, and Private Sale at 6.92%.
Airdrop and Seed Round at 5.00% each, Public Sale Option A1 at 2.00%, and Testnet Incentive Program at 0.62% (additional categories exist under "Show more" and are not fully itemized here). 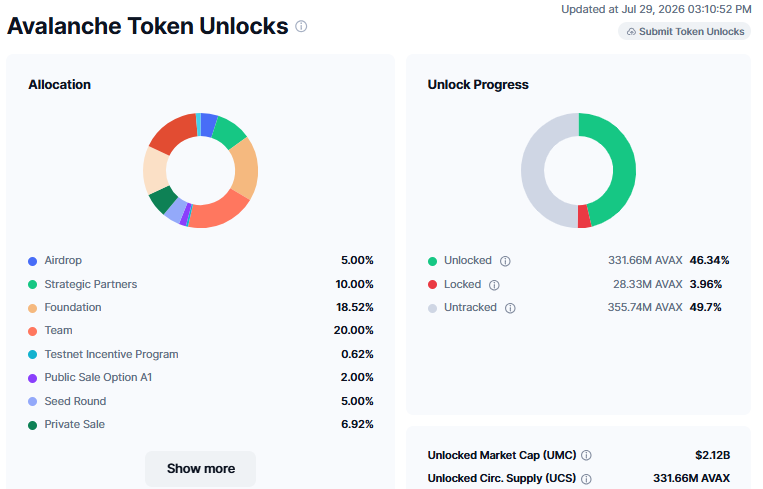
Data From BSC-bridged $AVAX
Of total supply, 46.34% (331.66M $AVAX) is unlocked, 3.96% remains locked, and 49.7% is categorized as untracked, giving an unlocked market cap of $2.12B.
Avalanche Unlock Schedule (2021–2030)
The cumulative unlock schedule shows $AVAX supply has been unlocking steadily since 2021 and continues on a gradual upward slope through 2030.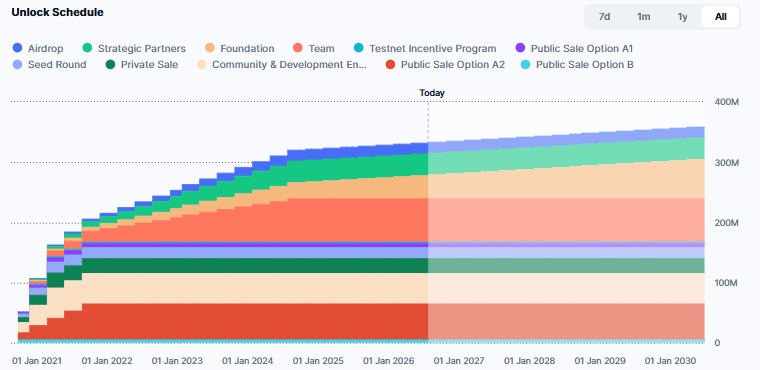
With no single dramatic cliff visible around today's date, supply growth looks more like a steady drip than a sudden overhang.
Avalanche Holder Growth (30-Day)
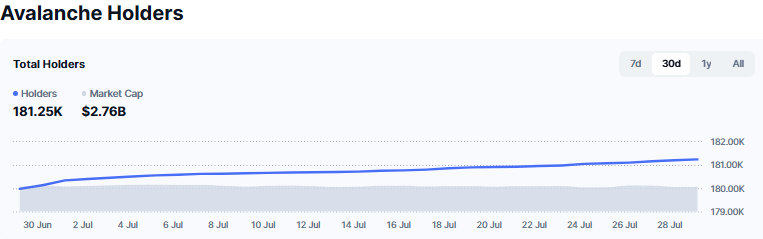
Total holders have grown modestly from roughly 179.5K to 181.25K over the past 30 days, a slow but steady uptrend that suggests continued organic adoption rather than a sudden spike tied to any single event.
Avalanche Top Holders (BSC-Bridged AVAX)
This data reflects BSC-bridged $AVAX specifically, not the full native supply.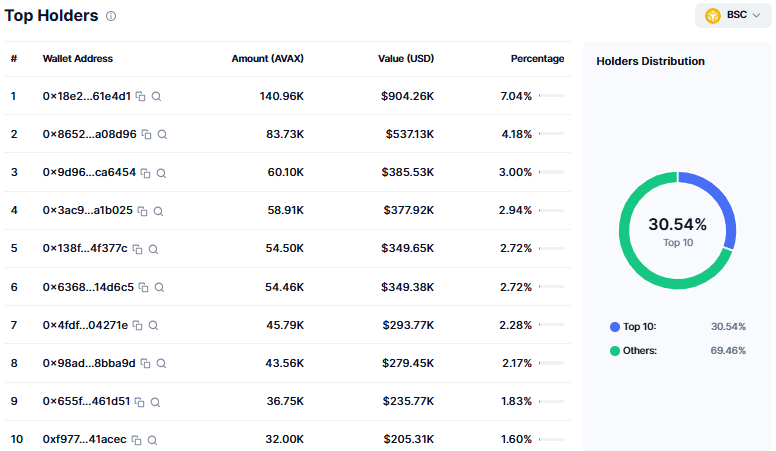
On this bridge, the top 10 wallets hold 30.54% of the bridged supply, led by a single wallet holding 7.04% ($904.26K), with the remaining 69.46% spread across other holders.
Concentration here should not be read as representative of $$AVAX's total holder base.
Avalanche Network Activity

The AVAX network has processed 3.64B total transactions at a current throughput of 27.7 TPS, with a median gas price of 0.0497 $AVAX (about $0.000007) and 5,041,770.70 $AVAX burnt in fees to date.
Transaction activity over the past 14 days totals 53.22M, and the trend spiked around July 24 before declining back down through July 28.
AVAX Technical Analysis: Chart and Key Levels
Pair: $AVAX/USD · Market: Spot · Timeframe: 4H · Source: TradingView · Timestamp: July 29, 2026, 15:51 UTC+5:30
AVAX trades at $6.4169, down 0.03% on the candle, sitting inside a consolidation range that has held for the past two-plus weeks after a sharp pullback from a mid-July high.
Both EMA 20 ($6.5133) and EMA 50 ($6.5252) sit just above the current price, acting as immediate overhead resistance.
RSI (14) at 42.93 is below neutral, reflecting the choppy, indecisive price action rather than strong momentum in either direction.
However, a prior dip below the $6.1210 zone was quickly reversed and marked as a "fake breakdown," which is now being watched as a level that needs to hold on any retest for the range to stay intact.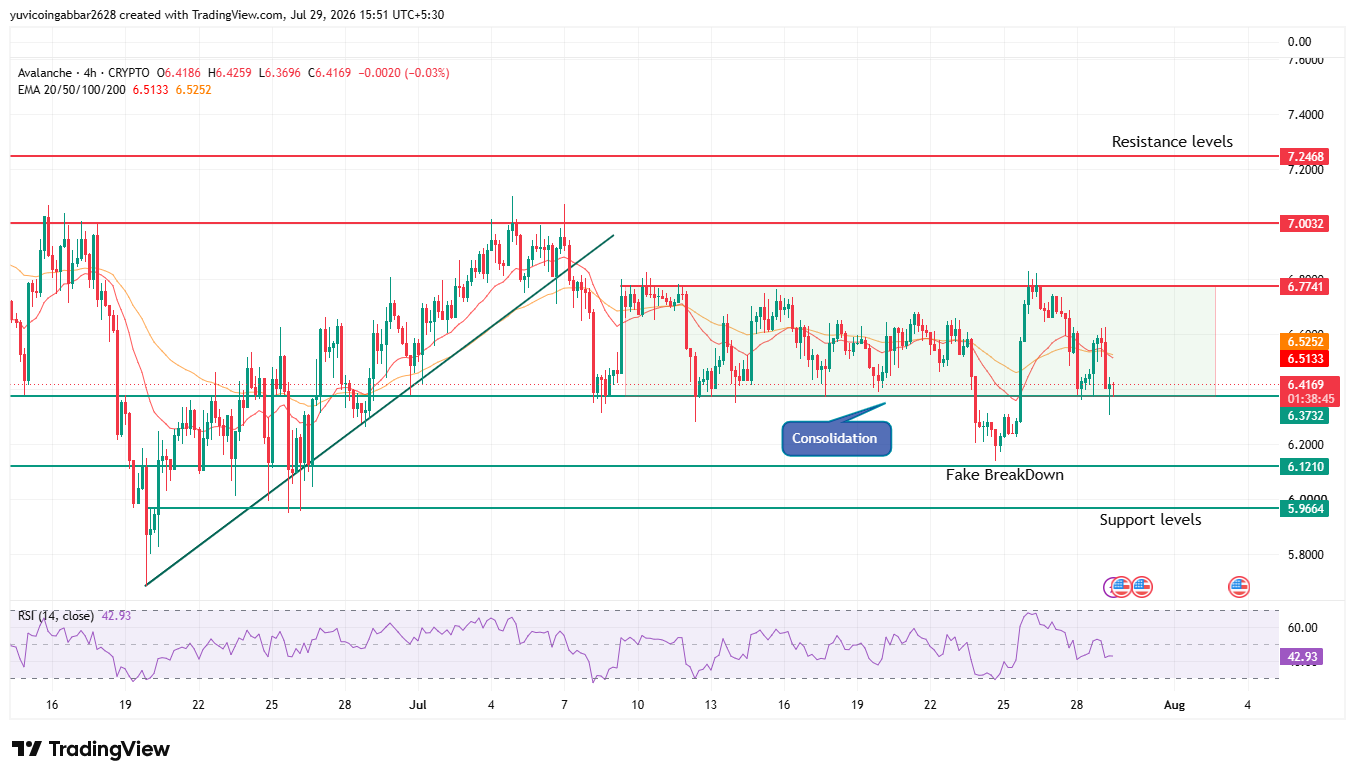
Level Type
Price
Label
Resistance 3
$7.2468
Prior high
Resistance 2
$7.0032
Upper resistance zone
Resistance 1
$6.7741
Top of consolidation range
Initial Recovery Level
$6.5133–$6.5252
EMA 20/50 cluster
Immediate Price Reference
$6.4169
Current price
First Confirmed Support
$6.3732
Consolidation floor
Support 2
$6.1210
"Fake breakdown" level
Deeper Support
$5.9664
Support zone below range
AVAX Price Prediction: Bull Case vs. Bear Case
Bull case: If $AVAX holds the $6.3732 consolidation floor and reclaims the EMA 20/50 cluster near $6.5133–$6.5252, the next target is $6.7741, with a stretch move toward $7.0032 and $7.2468 if momentum builds.
Bear case: A confirmed close below $6.1210, unlike the prior fake breakdown that quickly reversed, would signal the range is breaking down for real, opening a move toward $5.9664 and further downside.
Can $AVAX Reach $7.2468?
It's possible but requires the current range to resolve upward first.
$AVAX would need to reclaim the EMA 20/50 cluster and clear $6.7741 and $7.0032 with sustained volume before $7.2468 becomes a realistic target, a level not tested since the mid-July high.
What Happens If Support Breaks?
A confirmed break below $6.3732 would put the $6.1210 fake-breakdown zone back in focus. If that level fails to hold this time, it would open a slide toward $5.9664, unwinding the base built over the past two weeks.
Expert View
According to CoinGabbar analysts, $AVAX chart looks like a market pausing to digest a sharp move rather than one making a clear directional decision.
The fake breakdown below $6.1210 is a meaningful signal buyers stepped in quickly last time, and whether they do so again on a retest will likely determine whether this range resolves higher or turns into a deeper correction.
Fundamentally, steady staking participation (41.5% of supply) and a gradual, non-cliff unlock schedule reduce the odds of a supply-driven shock, keeping the near-term outlook mostly a technical question.
Disclaimer: This article is for informational purposes only and should not be treated as investment advice. Cryptocurrency markets are highly volatile, and readers should conduct their own research before making any financial decisions.