AVAX trades near $10.35, with resistance at 10.60–10.80 and support around $10.00 and $9.80. Analyst identifies $17, $22 and $28 as potential quarterly targets, contingent on overcoming near-
- AVAX trades near $10.35, with resistance at 10.60–10.80 and support around $10.00 and $9.80.
- Analyst identifies $17, $22 and $28 as potential quarterly targets, contingent on overcoming near-term resistance.
- AVAX’s RSI stands at 43.90 and its positive MACD histogram hints at improving momentum, while Kevin O’Leary highlights its enterprise capabilities.
Avalanche (AVAX) is trading near $10.35 as analyst Michael van de Poppe identifies $17, $22, and $28 as potential quarterly targets. However, AVAX remains below key resistance after retreating from September’s rally. Meanwhile, Kevin O’Leary has highlighted Avalanche’s technical strengths for enterprise and institutional developers.
AVAX Recovery Faces Resistance Above $10.80
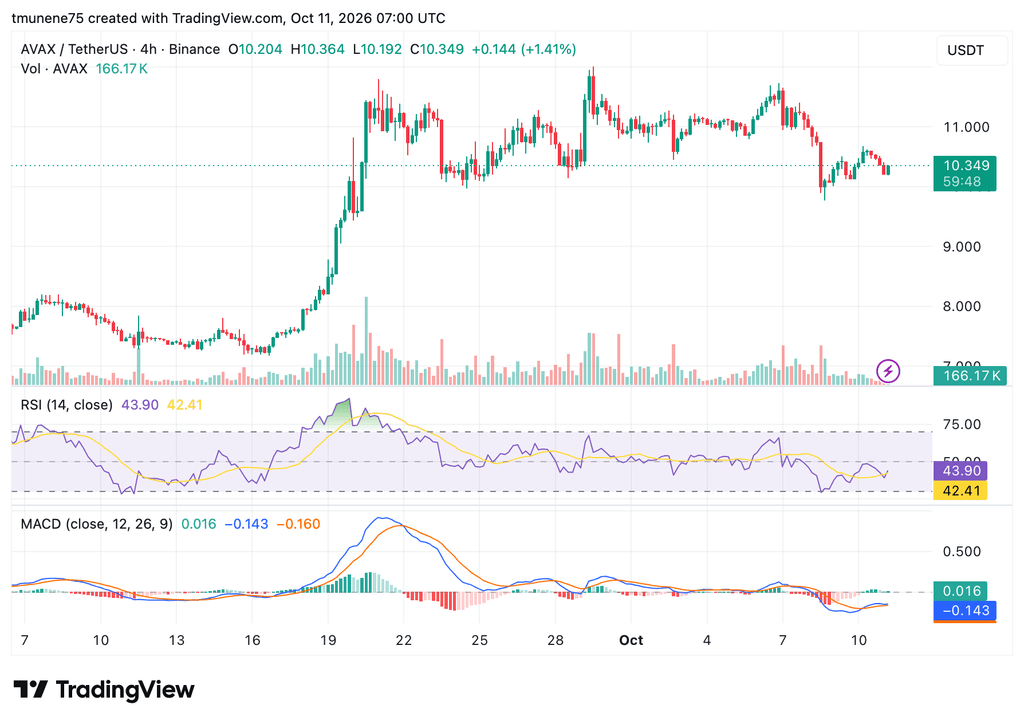
AVAX traded around 7.50–8.00 before climbing sharply between Sept. 19 and 21. The rally pushed the token above $9.00 and toward $11.50.
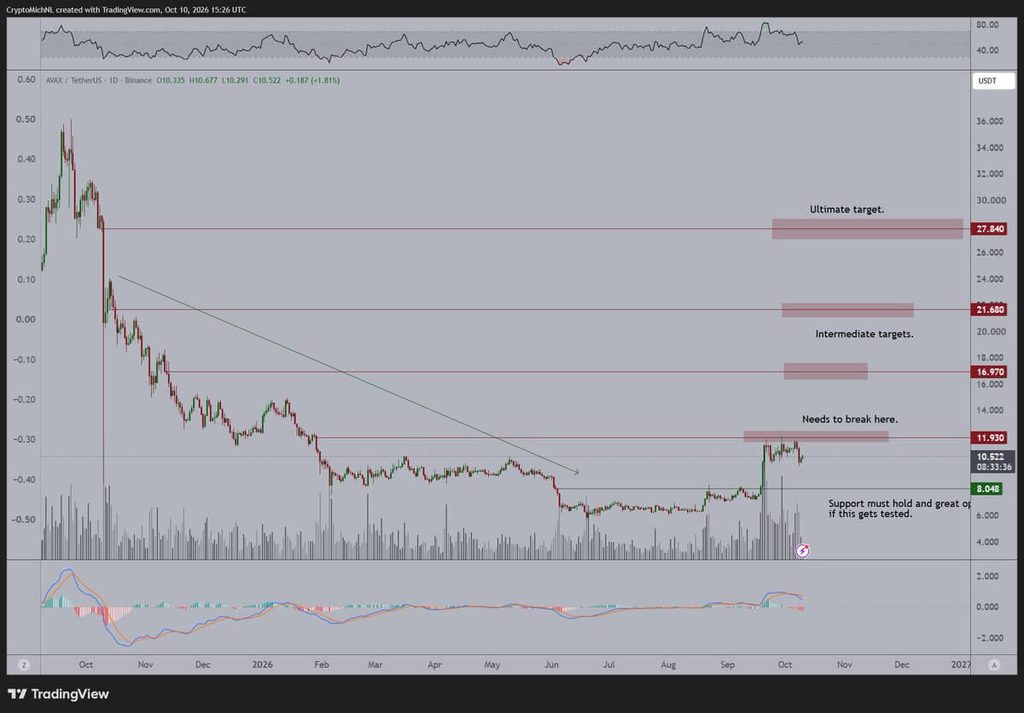
Source: Michael van de Poppe
However, the price later fluctuated between $10.30 and $11.20. An early October rally failed to produce a sustained breakout, while selling pressure on Oct. 8–9 pushed AVAX toward 9.80–10.00. Buyers have since supported a recovery.
On Oct. 11, 2026, AVAX traded at $10.349, up 1.41% on the latest four-hour candle. The immediate resistance range is at 10.60–10.80, followed by 11.00–11.20. Support remains near $10.00, with another level around $9.80.
Michael van de Poppe Maps $17, $22 and $28
Despite the recent pullback, Michael van de Poppe described AVAX’s price path as relatively clear. He identified a final hurdle before a possible acceleration and said he would buy if another dip occurred. His quarterly targets stand at $17, $22, and $28.
However, AVAX must first overcome the resistance levels identified on the four-hour chart. The Relative Strength Index reads 43.90, while its moving average is at 42.41. Although the RSI has risen slightly, it remains below the neutral 50 level.
Source:
TradingView
The MACD line stands at -0.143, compared with -0.160 for the signal line. Its histogram reads 0.016, suggesting a potential bullish crossover, although both lines remain below zero. Trading volume currently stands at 166.17K.
Kevin O’Leary Highlights Avalanche’s Enterprise Use
Kevin O’Leary also recognized Avalanche’s technical capabilities for enterprise development. He said S&P 500 technologists understand the chain’s merits when building capacity.
https://twitter.com/avax/status/2107874527938216168?s=20
Meanwhile, the price chart shows that a sustained move above $10.80 could expose resistance between $11.00 and $11.20. A drop below $10.00 could instead bring $9.80 back into focus. A stronger bullish setup would require increased volume and an RSI move above 50.