BANANAS31 just posted a 26.9% daily surge without a confirmed official catalyst, only a concentrated spike in spot buying on Binance. This Banana For Scale price prediction breaks down the da
BANANAS31 just posted a 26.9% daily surge without a confirmed official catalyst, only a concentrated spike in spot buying on Binance. This Banana For Scale price prediction breaks down the daily and weekly chart structure, whale wallet concentration, and bear, base, and bull price targets through early 2027, plus the key levels to watch.
Key Takeaways
BANANAS31 (Banana For Scale) trades near $0.01068, up 26.9% in 24 hours, with volume elevated.
The daily chart sits inside a longer descending channel while the weekly chart holds an ascending channel; the daily RSI at 69.52 is approaching overbought.
Key resistance sits at $0.0118–$0.0142; key support sits near $0.0066.
Supply is fully circulating (10B/10B, no unlock risk), but the top 10 wallets still control roughly 29% of tokens.
Base-case banana for scale price prediction: range-bound consolidation near current levels pending a confirmed catalyst.
Banana For Scale Price Prediction: Can BANANAS31 Hold Its Rally?
This banana for scale price prediction comes after BANANAS31 climbed 26.9% in 24 hours to trade near $0.01068 as of Aug 11, 2026, roughly 13:30 UTC, pushing the daily RSI to 69.52, just under overbought. Forbroader price-prediction coverage of similar breakout setups this week, the daily and weekly structures below are the ones worth watching first.
Market Overview: Price Action and Volume
Per CoinMarketCap, BANANAS31 traded at $0.01068 (+26.9% 24h) with a market cap of $106.83M, a 24-hour volume of $23.65M (down 41.05% from the prior period despite the price gain), and a Vol/Mkt Cap ratio of 21.12%. Because circulating and max supply are both 10 billion tokens, FDV equals market cap exactly; there is no dilution overhang here, unlike many low-float launches.
The token sits 82.9% below its July 11, 2025, all-time high of $0.05919 and 3,077.54% above its Nov 18, 2024, all-time low of $0.0003185. Volume is split across venues, with LBank ($26.04M) and Binance ($14.43M) carrying the bulk of activity, alongside smaller flow on BingX, MEXC, and Bitget, a pattern also visible in thewider memecoin sector this month.
Catalyst: What's Actually Driving the Move
CoinMarketCap's own market summary attributes the rally primarily to a concentrated spike in spot buying on Binance, where BANANAS31 ranked as a top gainer, with only modest, broader rotation into meme tokens as a secondary factor.
Traders should treat this as volume-led momentum rather than a confirmed fundamental catalyst and watchexchange listing activity for any disclosures that would firm up the story.
Derivatives data adds a clue: 24-hour liquidations totaled $17.02K, with $10.30K in short liquidations against $6.73K in longs, consistent with a short squeeze amplifying the spot-driven move.
Tokenomics and Whale Wallet Analysis
BANANAS31 has a total, max, and circulating supply of 10 billion tokens, fully diluted already, so there is no scheduled unlock to track, though it's still worth checking thecoin events calendar periodically for any surprise supply actions.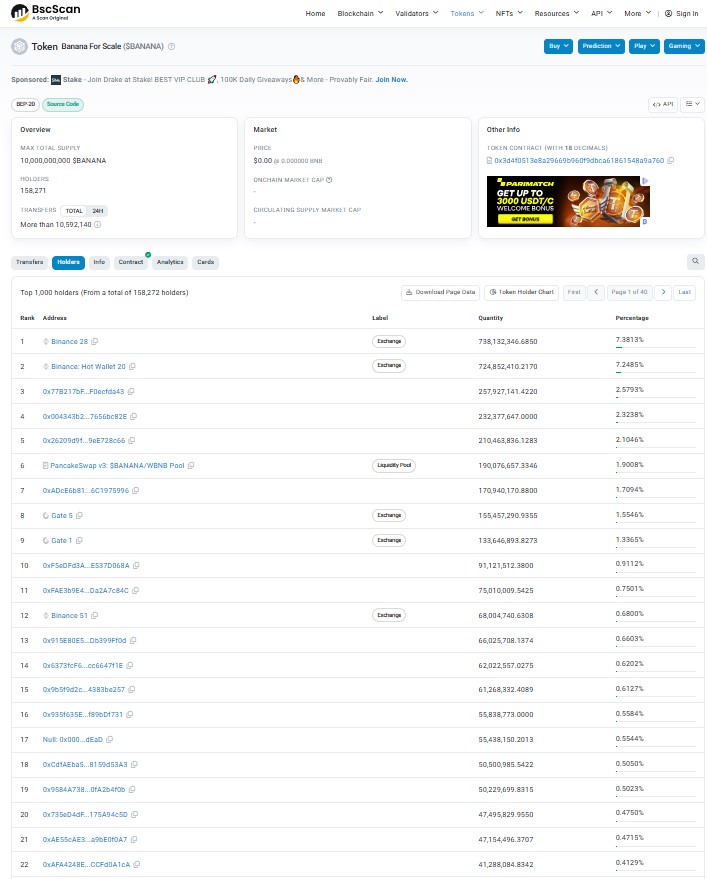
Per BSCScan, the top 10 holders control roughly 29.05% of the supply.
Categorized: exchange-labeled wallets (Binance 28, Binance Hot Wallet 20, Gate 5, Gate 1) hold about 17.52% combined; the PancakeSwap V3 BANANA/WBNB liquidity pool holds 1.90%; and five unlabeled addresses account for the remaining 9.63%, best treated as unknown/unconfirmed rather than assumed team or treasury wallets. Holders overall number 158,231, a broad base for a token of this size.
Technical Analysis: Daily Chart
The daily BANANAFOUSD chart shows opening at $0.0091085 and trades at $0.0106543, up 16.97% intraday, with RSI at 69.52 and price now well above its daily EMA (20) of $0.0079748. 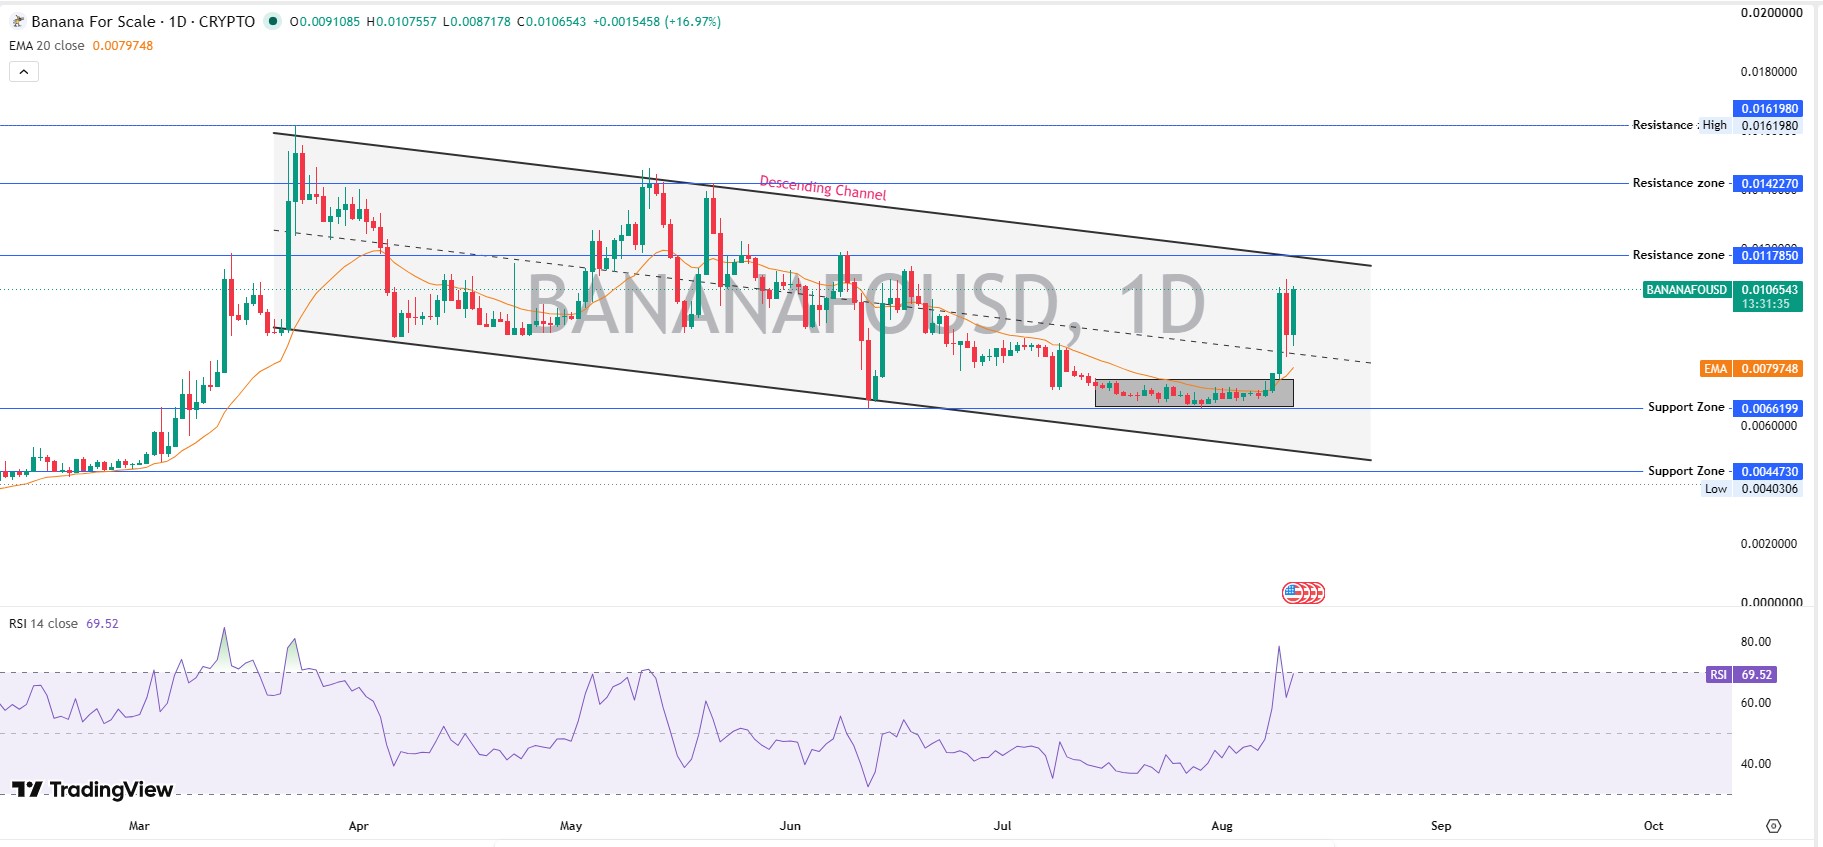
The broader daily structure remains a descending channel dating back to March 2026, meaning this rally is testing the upper boundary of a still-bearish longer-term pattern rather than confirming a fresh uptrend.
Resistance stacks at $0.0117850, $0.0142270, and a channel high of $0.0161980; support sits at $0.0066199, with a deeper floor at $0.0044730 - $0.0040306.
Technical Analysis: Weekly Chart
On the weekly BANANAFOUSD chart, price trades at $0.0106913 after opening at $0.0105152, with RSI at 58.30, elevated but not yet overbought, and price holding above its weekly EMA (20) of $0.0088770. 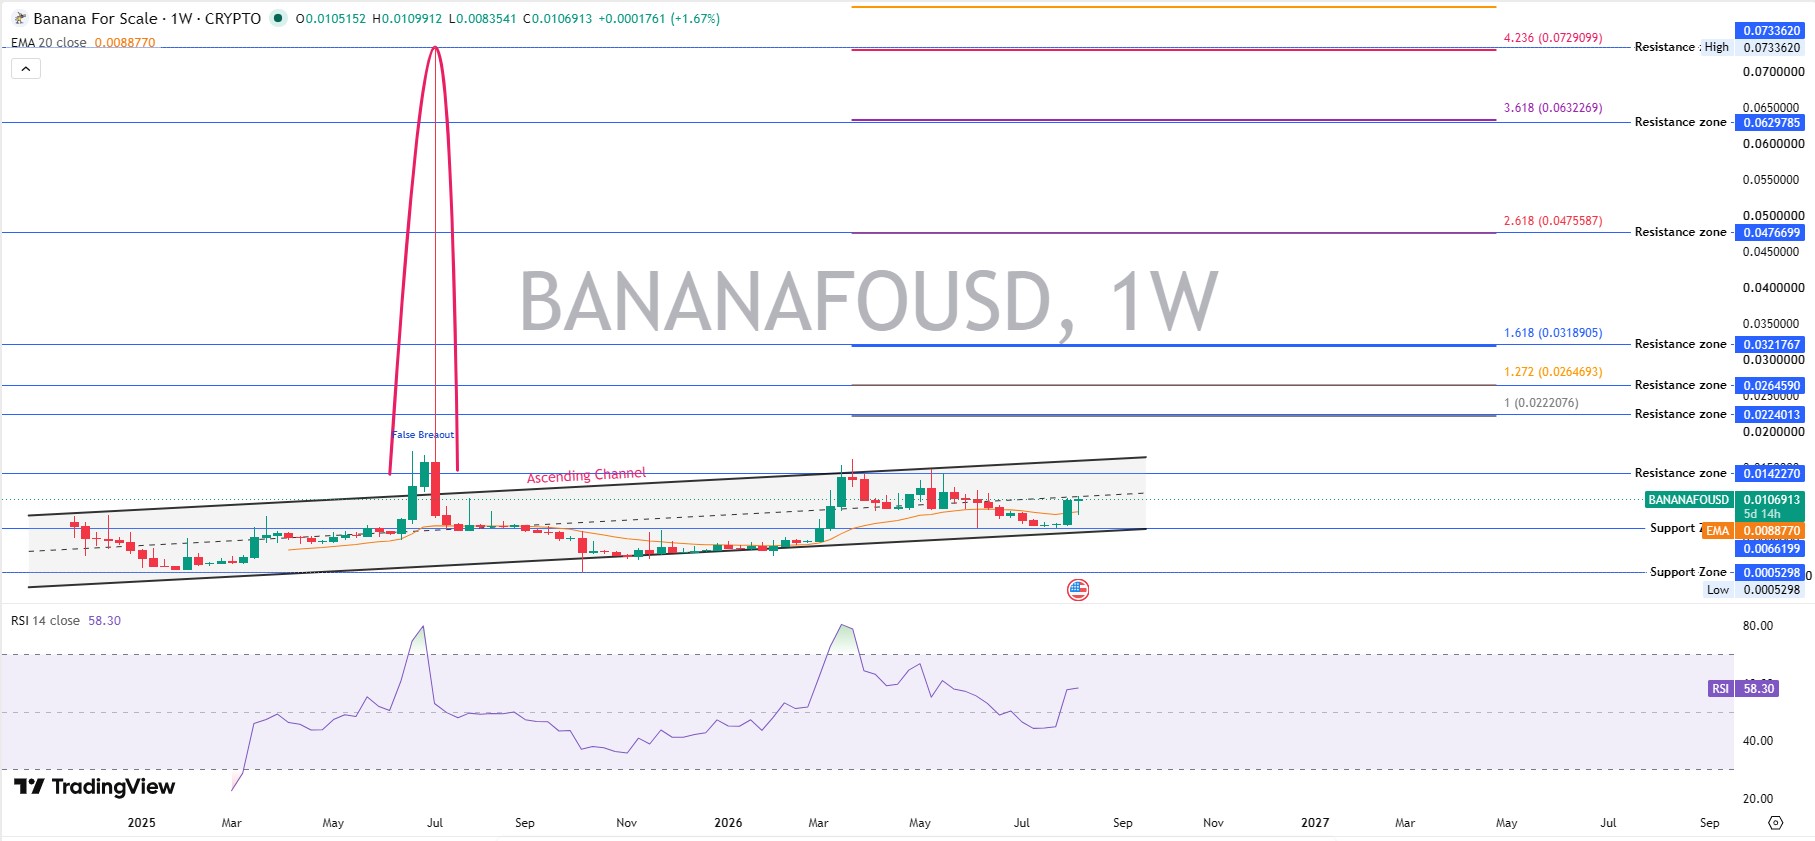
This chart tells a more constructive story: an ascending channel has held since roughly November 2025, a series of higher lows and higher highs.
BANANAS31 already produced one false breakout in mid-2025, spiking sharply above the channel before round-tripping the entire move within weeks, so this rally needs at least one more confirmed weekly close above resistance before it can be read as more than a repeat.
Key Levels
Fibonacci extensions drawn from the ascending channel mark resistance at $0.0224013 (1.0), $0.0264590 (1.272), $0.0321767 (1.618), $0.0476699 (2.618), and $0.0733620 (4.236), all well above the current price and only relevant if the daily descending channel breaks first. Near-term support sits at $0.0066199, with a deep floor near $0.0005298.
Banana For Scale Price Prediction: Bear, Base, and Bull Case
Timeframe
Bear Case
Base Case
Bull Case
Probability
Key Level
Invalidation
7-Day
Fade toward EMA20 near $0.0080 as RSI cools from overbought
Consolidation between $0.0095–$0.0118 inside the recent range
Push to $0.0142 resistance if spot volume stays elevated
25% / 50% / 25%
$0.0080 / $0.0107 / $0.0142
Daily close below $0.0066 support
30-Day
Reversion to $0.0066 support if volume fades and the short squeeze unwinds
Range between $0.0080–$0.0142 as the daily descending channel caps upside
Break above $0.0142 toward the $0.0162 channel high on sustained buying
30% / 45% / 25%
$0.0066 / $0.011 / $0.0162
Loss of the weekly ascending channel's lower trendline
Early 2027
Drop toward the $0.0044–$0.0005 zone if this repeats the 2025 false breakout
Consolidation between $0.010–$0.022 as holder concentration and retail demand roughly offset
Extension toward $0.0264–$0.0318 (1.272–1.618 Fib) if volume and new listings sustain
35% / 45% / 20%
$0.0044 / $0.016 / $0.0264
Repeated rejection near $0.0142 on falling volume, echoing the 2025 pattern
Source: TradingView (BANANAFOUSD, 1D/1W), CoinMarketCap, BscScan, CoinGlass; snapshot: Aug 11, 2026, 13:30 UTC
This banana-for-scale price prediction leans base-case across all three horizons: the weekly ascending channel argues for patience, but the longer daily descending channel and the coin's own 2025 false-breakout history mean the bullish case still needs confirmation rather than assumption.
Risks and Invalidation
The clearest risk to any bullish Banana For Scale price prediction is precedent: BANANAS31 already staged a sharp breakout and collapse in mid-2025, and the current move shares the same volume spike signature. Holder concentration compounds this; the top 10 wallets hold about 29% of supply, and coordinated selling from the unlabeled addresses among them could outpace the $23.65M in daily volume quickly.
Macro conditions matter too: risk-asset sentiment tied tothe Federal Reserve's policy path can pull capital away from meme tokens like BANANAS31 on short notice, and Wednesday's US CPI print is a specific near-term catalyst for that kind of shift. Regulatory developments such asthe CLARITY Act's progress are a separate variable worth tracking, since policy clarity tends to move sentiment across the whole altcoin market, memecoins included.
Glossary
RSI (Relative Strength Index): A momentum indicator measuring the speed of price moves; above 70 typically signals overbought conditions.
EMA (Exponential Moving Average): A trend line that weights recent prices more heavily than older ones.
FDV (Fully Diluted Valuation): A token's price multiplied by its max supply, showing total value if every token were circulating.
Fibonacci Extension: A set of price levels projected beyond a prior price swing, used to estimate potential resistance targets.
Liquidation: The forced closure of a leveraged futures position when losses breach margin requirements.
Ascending/Descending Channel: A technical pattern formed by two parallel trendlines connecting a series of higher (ascending) or lower (descending) highs and lows.
Conclusion
BANANAS31's rally is real in terms of volume and price action, but it's happening without a confirmed catalyst and inside a longer daily downtrend that hasn't broken yet.
Anyone following this Banana For Scale price prediction should weigh the $0.0118–$0.0142 resistance band against the $0.0066 support floor, keep the coin's 2025 false-breakout history in mind, and checkongoing crypto news coverage for any confirmed catalyst, listing, partnership, or other event before treating this move as more than a volume-driven spike.
Disclaimer: This is not financial advice. Cryptocurrency markets are highly volatile; do your own research before trading.