Biconomy has traders on edge today after a wild swing that came out of nowhere. $BICO ripped higher last week before slamming back down hard, and the sudden reversal has everyone watching the
Biconomy has traders on edge today after a wild swing that came out of nowhere.
$BICO ripped higher last week before slamming back down hard, and the sudden reversal has everyone watching the chart closely. Price is now sitting around $0.044 after the drop.
This Biconomy Price Prediction breaks down the liquidation data behind the move, the volume flowing through it, and the levels that could decide what happens next.
Biconomy is a crypto project, according to the project's own materials. Stick around till the end, because this one has been moving fast.
Market data checked on August 10, 2026. At 14:46 UTC+5:30
Biconomy Price Prediction Today: Market Overview
Metric
Value
Price
$0.043631
24h Change
-20%
24h Range
$0.03805 – $0.05566
Market Cap
$44.501M
FDV
$44.501M
24h Volume
$206.332M
TVL
$128,578
Circulating Supply
1B BICO
Total Supply
1B $BICO
Max Supply
1B $BICO
Source: Data from CoinGecko as of August 10, 2026, at 14:46 UTC+5:30. Figures may vary slightly across other tracking websites.
Biconomy Liquidation and Volume Data
Liquidations
Window
Total
Long
Short
1h
$83.58K
$9.14K
$74.44K
4h
$149.29K
$22.39K
$126.90K
12h
$315.05K
$146.27K
$168.78K
24h
$1.22M
$552.54K
$666.54K
Short liquidations lead across every window, but long liquidations are close behind, especially over the 24-hour window. 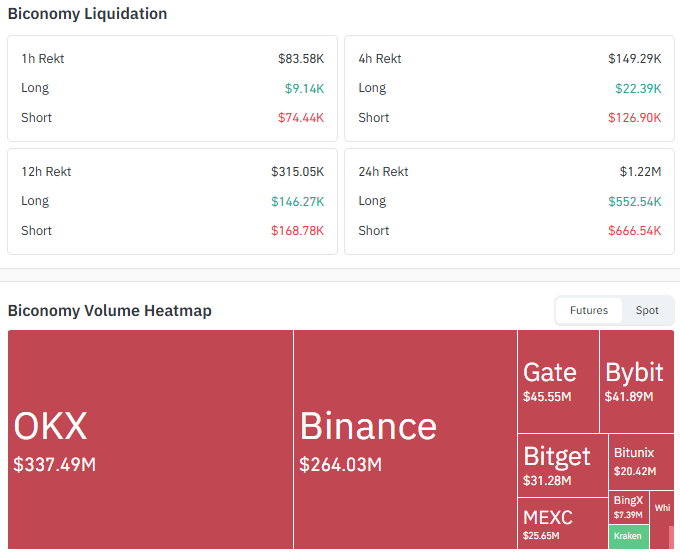
Source: Data From CoinGlass
That mix points to sharp moves in both directions, a rally that squeezed shorts followed by a hard drop that hit longs.
Futures Volume by Exchange (24h)
Exchange
Volume
OKX
$337.49M
Binance
$264.03M
Gate
$45.55M
Bybit
$41.89M
OKX and Binance carry most of the futures volume between them, showing this move has been driven by heavy trading on the biggest exchanges rather than thin, low-liquidity activity.
Biconomy Price Prediction Chart: Technical Analysis
Pair: BICO/USDT · Timeframe: 1H · Source: TradingView · Timestamp: August 10, 2026, 14:46 UTC+5:30
BICO is trading at $0.043631, Price had rallied hard through early August, climbing from around $0.027061 up toward $0.07000, before a massive red candle wiped out a big chunk of those gains in a short window.
Price is now consolidating in a tight range between roughly $0.038064 and $0.049096. RSI (14) is at 45.15, sitting below the midpoint, reflecting the pullback in momentum after the drop.
The trend stays bearish as long as the price trades below the EMA 20 and EMA 50 near $0.045406 to $0.048990.
If price reclaims that zone and holds above it, we can assume a bullish trend until proven.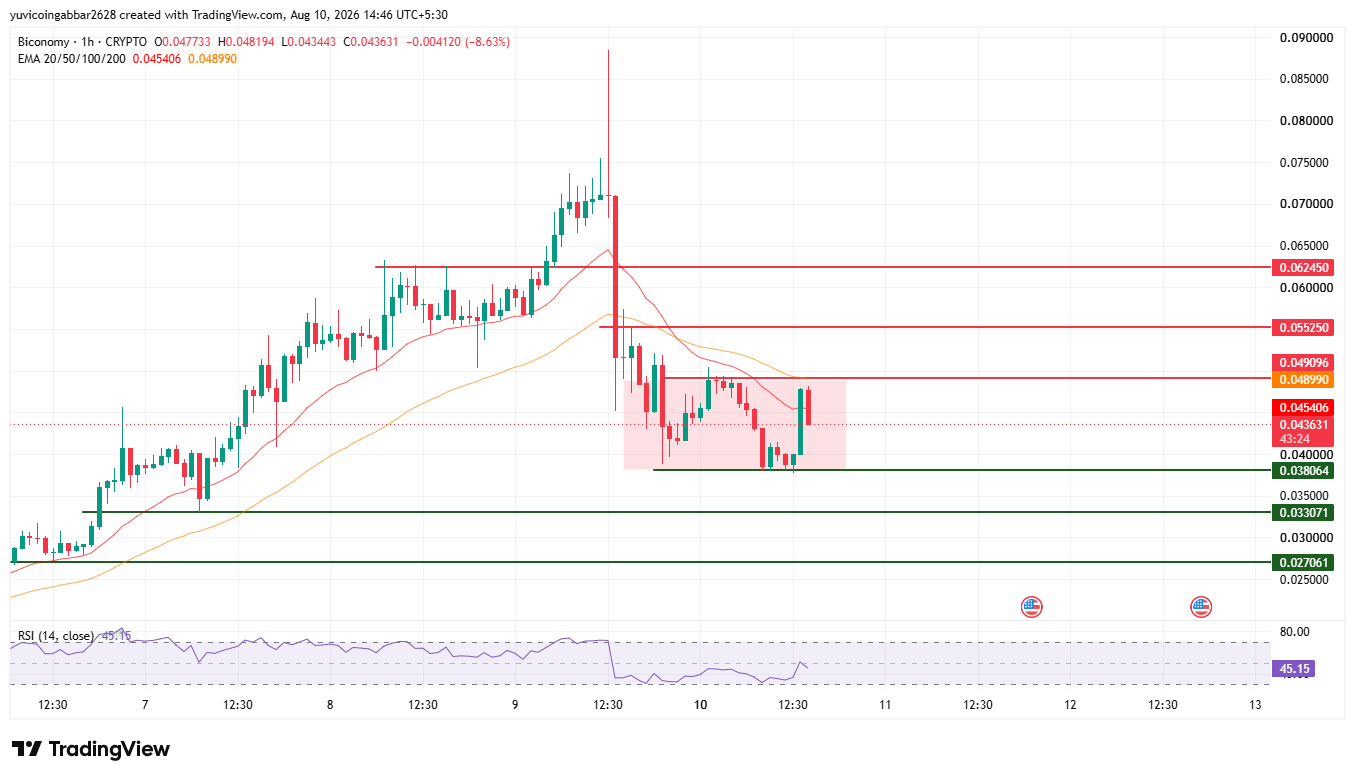
BICO future price: Support and Resistance Levels
Level Type
Price
Resistance 3
$0.062450
Resistance 2
$0.055250
Resistance 1 (nearest)
$0.048990
Immediate Price Reference
$0.043631
Nearest Support
$0.038064
Deeper Support
$0.033071
Structural Floor
$0.027061
BICO future price: EMA levels
EMA
Price
EMA 20 (near resistance)
$0.045406
EMA 50 (near resistance)
$0.048990
Biconomy Forecast: Bull Case vs. Bear Case
BICO price target 2026 Bull case: Reclaiming the EMA cluster near $0.045406 to $0.048990 and holding above $0.038064 would start to repair the chart.
A confirmed move above $0.048990 would open the path toward $0.055250 and then $0.062450.
BICO price target 2026 Bear case: Staying below the EMA cluster keeps sellers in control.
A close below $0.038064 would expose $0.033071, and losing that would put the structural floor at $0.027061 in view.
BICO price target: Can BICO Reach $0.062450?
$0.062450 is the highest resistance marked on the chart and lines up with the level price that broke down during the reversal.
Getting back there would take a multi-stage move: first reclaiming the EMA cluster near $0.045406 to $0.048990, then clearing $0.055250, before price could realistically test that level again.
What Could Invalidate the Bearish Setup?
A strong close back above the EMA cluster near $0.048990, followed by a hold above $0.038064, would start to momentum shift back toward buyers.
Continued rejection at the EMAs and a break below $0.038064 would keep the setup bearish and put $0.033071 and $0.027061 in play.
Biconomy Price Prediction: Expert View
According to CoinGabbar analysts, The sharp reversal after last week's rally is the story on this chart, and it shows up clearly in both the price action and the liquidation data.
RSI at 45.15 shows momentum has cooled off from the euphoric highs without falling into deeply oversold territory yet.
Heavy long liquidations over the past 24 hours confirm that traders caught the drop off guard, while high volume on OKX and Binance shows this wasn't a low-liquidity move.
The $0.038064 to $0.048990 range is the zone to watch: holding the lower end keeps the consolidation intact, while reclaiming the upper end would be the first real sign buyers are stepping back in.
Biconomy Price Prediction: Data Sources
Price, market cap, and supply data referenced from a market tracker snapshot. Liquidation and futures volume data referenced from Coinglass.
Price and EMA data referenced from a 1H BICO/USDT chart via TradingView, timestamped August 10, 2026, 14:46 UTC+5:30.
Disclaimer
This piece is for informational purposes only and isn't financial advice. The levels and scenarios above are based on technical chart analysis and publicly available data at the time of writing, and crypto markets can move sharply within hours, so past patterns don't guarantee future outcomes. It's worth doing independent research and considering your own risk tolerance before acting on any of the levels discussed here.