Binance lost 23,137 BTC in net outflows during the week ending Sept. 27, according to CryptoQuant. That is the largest weekly drain since June 2023. Since Sept. 20, the exchange's Bitcoin res
Binance lost 23,137 BTC in net outflows during the week ending Sept. 27, according to CryptoQuant. That is the largest weekly drain since June 2023. Since Sept. 20, the exchange's Bitcoin reserves have fallen by nearly 40,000 BTC.
At the same time, large holders are sending more stablecoins to the exchange. Their rolling 30-day stablecoin inflows to Binance rose 40% between Aug. 15 and the end of September, from $21.7 billion to $30.5 billion. Bitcoin leaves the exchange while cash arrives.
What the Data Shows
Falling exchange balances usually mean holders are moving coins into self-custody or long-term storage. CryptoQuant calls withdrawals from a widely used platform like Binance a longer-term investment behavior. It reads the trend as accumulation.
The last comparable week came in June 2023, when Binance's balance dropped by 44,942 BTC. Bitcoin then rose from $26,300 to $30,500 in the following weekly candle and hit 12-month highs. That period was part of the recovery from the 2022 bear market.
Stablecoins on exchanges are seen as dry powder. They are cash waiting to buy crypto. Rising whale balances point to growing interest in adding exposure.
How Bitcoin Got Here
Bitcoin hit its all-time high of $126,080 on Oct. 6, 2025, exactly one year ago today. The decline that followed had no single trigger and took the price near $60,000 by February. It revisited that zone in June.
Whale stablecoin inflows to Binance followed the same path. They exceeded $61 billion at the October 2025 peak, then faded through a long lull. The recent rise is the first sustained reversal of that trend.
The rebound began in mid-August. The US Treasury announced it would double its long-dated debt buybacks, and investors read this as relief for the bond market. Buybacks have since tripled in size. Bitcoin gained 43% in the third quarter, its best third quarter since 2017, and returned to $87,000 in mid-September for the first time in eight months.
Where the Price Stands Today
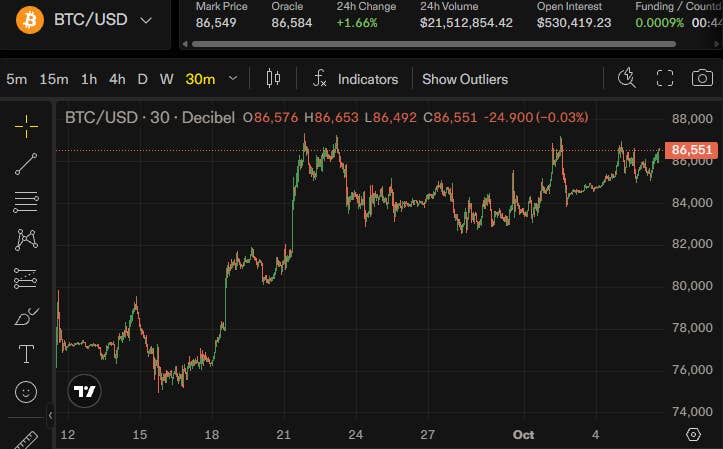
Bitcoin trades near $85,500, about 32% below its record. Since Sept. 21 it has stayed in a range between $82,500 and $87,400. The 2026 yearly open at $87,570 sits just above and acts as resistance.
CryptoQuant argues that outflows plus fading sellers could push Bitcoin out of this range quickly. That is a forecast, not a confirmed trend. Glassnode reports less aggressive upward momentum than in mid-September, and profit-taking remains active, especially above $85,000.
The Macro Backdrop
Interest rates are the main obstacle. The Federal Reserve raised rates in September. The 10-year Treasury yield sits near 5.31% and the 30-year near 5.67%, close to 24-year highs. Delphi Digital notes that a risk-free yield above 5% makes every risky asset work harder to attract money.
Recent data eased some pressure. The US added only 29,000 jobs in September, against forecasts of 80,000. CME FedWatch now puts the odds of an October hike near 24%, down from above 75% a week earlier. The next Fed meeting is Oct. 28, and September meeting minutes arrive Wednesday.
Institutional demand is mixed. US spot Bitcoin ETFs took in about $293 million over two sessions, then lost $89.9 million on Monday. Cumulative ETF net inflows have slipped 5.8% since the peak, from $61.3 billion to $57.7 billion.
Reasons for Caution
The June 2023 comparison has limits. This week's outflow was about half that record. Rates were also far lower in 2023 than the current levels near 5%.
Exchange outflows do not prove accumulation. Coins can move between wallets that the same owner controls, and some withdrawals reflect custody changes rather than new buying. Binance is one exchange, so its flows do not cover the whole market.
Stablecoin inflows carry two readings. Whales may be preparing to buy, or they may be preparing to trade in either direction. Their 30-day inflows of $30.5 billion are still about half the October 2025 peak.
What to Watch Next
A daily close above $87,570 would clear the main resistance level and test the accumulation thesis. A drop below $82,500 would break the range and weaken it. Bond yields and the Fed's tone will likely set the direction.
Cycle analysts have pointed to the fourth quarter as the traditional time for bear market lows, roughly a year after the peak. Binance's outflows are the first on-chain evidence of heavy buying in months. Price, ETF flows, and yields will show whether it holds.