Crypto finally has some momentum again. Bitcoin pushed through $84,000 and reached roughly $84,875 over the latest 24-hour period before settling around $84,550. That puts BTC up more than 2%
Crypto finally has some momentum again.
Bitcoin pushed through $84,000 and reached roughly $84,875 over the latest 24-hour period before settling around $84,550. That puts BTC up more than 2% on the day and at its strongest level in roughly a week.
XRP has moved even faster. The token jumped more than 4% to approximately $1.38 after trading near $1.32 earlier in the session. It has now recovered considerably from the October low around $1.255.
The broader market is participating as well. Recent market data showed total crypto capitalization rising approximately 2.6%, so this is not simply a Bitcoin-only move.
The charts look better. The problem is that both BTC and XRP have reached momentum readings that make chasing the move increasingly risky.
Macro Setup: Better Flows, but the Fed Is Still Looming
One development supporting Bitcoin has been the return of money to U.S. spot ETFs.
The funds attracted roughly $526.7 million on October 19, their strongest daily intake since September. BlackRock’s IBIT accounted for more than the total net figure because some competing funds recorded withdrawals. October 20 then produced a much smaller positive flow of approximately $23 million.
That tells us institutional demand has improved, but I would not describe ETF buying as consistently powerful yet.
The Federal Reserve remains the larger macro obstacle.
The next rate decision arrives on October 28. Recent economist surveys lean strongly toward no change this month, although hotter inflation has kept another increase later in 2026 on the table. Treasury yields remain elevated, with the 10-year recently around 5.10%.
Middle East developments add another variable. Oil remains elevated as hopes for a quick U.S.-Iran diplomatic resolution have weakened. Higher oil can feed inflation expectations and indirectly reinforce the case for tighter monetary policy.
Crypto is therefore rallying into a macro environment that has improved at the margin, but is far from comfortable.
Bitcoin Price: The Rally Is Strong, Perhaps Too Strong Short Term
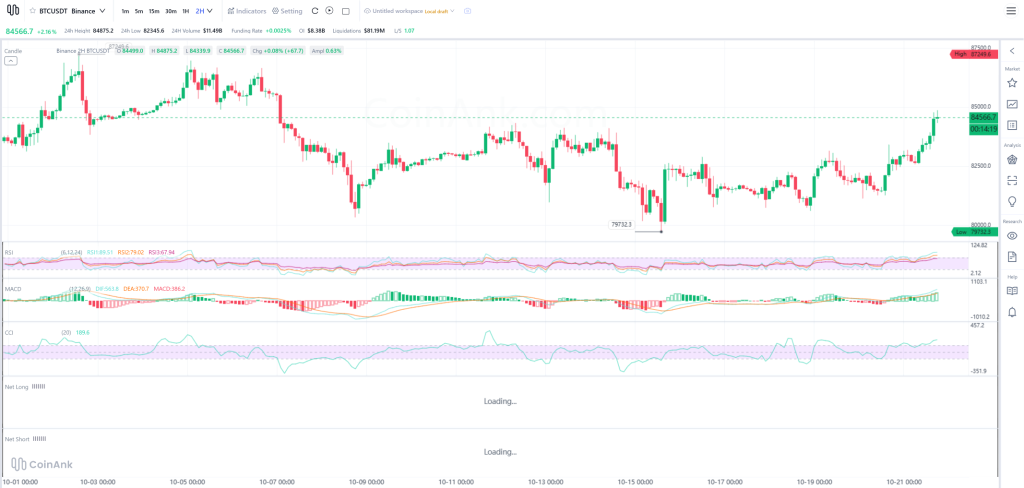
The Binance BTC/USDT two-hour chart is considerably healthier than it was a few days ago.
Bitcoin formed a local bottom around $79,732 on October 15. Since then, buyers have gradually constructed higher lows before accelerating through $82,500 and then $84,000.
BTC is now around $84,566.
The price structure is bullish.
The indicators are where things become more complicated.
 Source: CoinAnk
Short RSI has reached approximately 89.5. The medium reading is around 79.0, and even the longer RSI is close to 67.9.
That is extremely strong momentum, but an RSI near 90 on the short setting is also a warning that Bitcoin has moved very quickly.
I would not interpret that as a reason to immediately short BTC. Strong trends can remain overbought longer than traders expect.
But it does mean a pullback or sideways cooling period would be normal.
MACD is far more encouraging from a trend perspective. DIF is around 563.8 versus DEA near 370.7, with the positive histogram expanding strongly. Momentum has accelerated instead of fading during the latest advance.
CCI near 189.6 tells a similar story: buyers clearly control the immediate move, but the market is stretched.
Read also: Claude AI Predicts Bitcoin and XRP Prices After the October FOMC Meeting
Bitcoin Price Prediction for October 22
The next area I would watch is $85,000.
A sustained move above it would put $86,000-$87,250 back on the radar. The latter area corresponds closely with the October high near $87,249.
However, I would not be surprised to see Bitcoin retest the breakout first.
The most useful support now looks like $83,000-$83,500. Below that, $82,000-$82,500 becomes important.
My scenarios for today are:
BTC setup
Price path
Bullish continuation
Hold $84K → break $85K → $86K-$87.2K
Cooling phase
$83K-$85K consolidation
Failed move
Lose $83K → $82K-$82.5K
My base case is consolidation between roughly $83,500 and $85,500 with occasional attempts above $85,000.
Bitcoin looks bullish, but after an RSI reading close to 90, I would prefer to see price digest the rally rather than go vertically higher.
XRP Price: Stronger Than Bitcoin, but Even More Overheated
XRP’s recovery is even more aggressive.
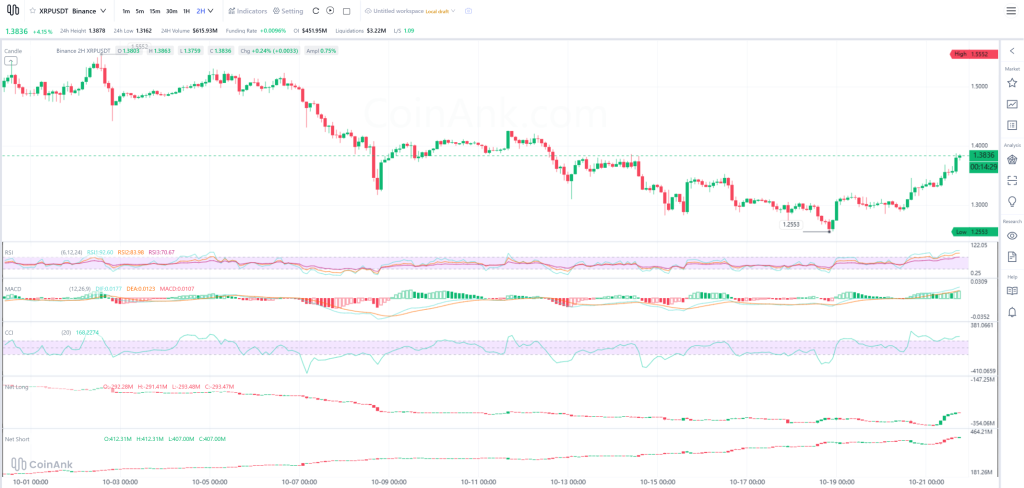
The Binance XRP/USDT two-hour chart shows the token moving from approximately $1.255 on October 19 to around $1.384 today.
That is roughly a 10% recovery from the local low in only a few days.
Price has also cleared several short-term resistance areas around $1.30, $1.33 and $1.35.
Momentum confirms the move.
 Source: CoinAnk
Short RSI is approximately 92.6.
Medium RSI is around 84, and the longer reading has now moved above 70.
Those are extreme readings.
Again, that does not automatically mean XRP must fall. It means the easy part of the short-term recovery may already have happened.
MACD remains strongly positive, with DIF around 0.0177 versus DEA near 0.0123 and a positive histogram around 0.0107.
CCI is approximately 168, another indication that XRP has entered a strongly extended momentum phase.
The positioning data adds an interesting layer.
Net longs remain around negative $293 million, whereas the displayed net-short reading is approximately $407 million.
Despite XRP rallying, bearish positioning remains substantial.
If price keeps pushing higher, that positioning could create additional covering pressure. But I would not assume a short squeeze solely from these figures.
Read also: This XRP Price Prediction Maps a 5-Step Road to $1,000
XRP Price Prediction for October 22
The XRP price is approaching an important area around $1.40.
That is the first level I would watch today.
If $1.40 breaks and holds, the recovery could extend toward $1.42-$1.45.
Above that, $1.50 becomes realistic again.
The problem is that XRP is already deeply overbought on the short-term indicators.
The first pullback zone is around $1.35-$1.36. I would consider a controlled retest there completely normal.
Below $1.35, $1.32-$1.33 becomes more important.
XRP setup
Price path
Bullish continuation
Break $1.40 → $1.42-$1.45
Controlled pullback
$1.35-$1.40
Deeper retracement
Lose $1.35 → $1.32-$1.33
My base case is XRP trading roughly between $1.35 and $1.42 during October 22.
The chart has improved dramatically compared with only a few days ago.
But at an RSI above 90, I would not confuse strong momentum with a low-risk entry.
Both Bitcoin and XRP are finally giving bulls something to work with. For October 22, the question is no longer whether buyers can produce a bounce.
It is whether they can hold their newly reclaimed levels once the first wave of profit-taking begins.
For more crypto news and price predictions, click here.
Subscribe to our YouTube channel for daily crypto updates, market insights, and expert analysis.
The post Bitcoin and XRP Price Predictions for Today (October 22) appeared first on CaptainAltcoin.