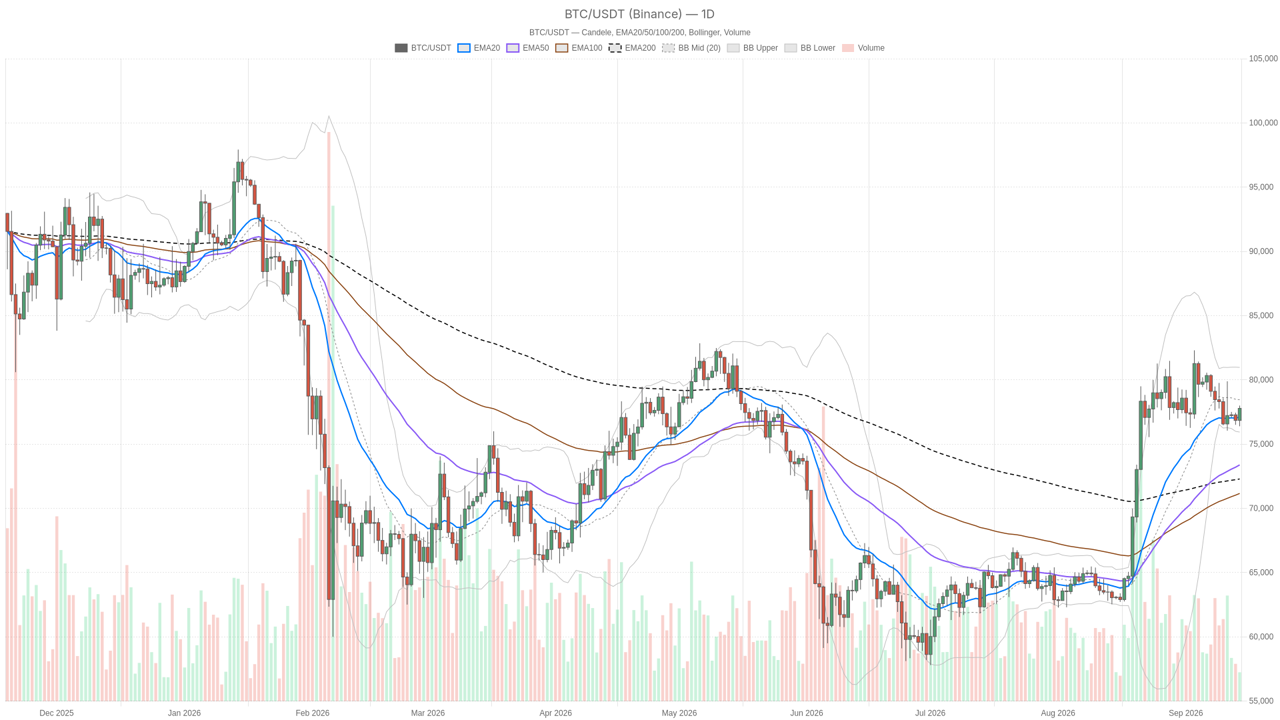
Bitcoin is holding $77,782 (September 14, 2026), above all three of its main daily moving averages. On paper, that is a clean bullish structure. Under the surface, momentum has been cooling —
Bitcoin is holding $77,782 (September 14, 2026), above all three of its main daily moving averages. On paper, that is a clean bullish structure. Under the surface, momentum has been cooling — and that gap between trend and momentum is what will decide the next move.
Here is the setup in five numbers, then the two scenarios we are watching.
The setup in five numbers
- Price above every daily EMA. EMA20 $77,097, EMA50 $73,382, EMA200 $72,287. When price stacks above all three, dips have tended to get bought.
- Daily MACD histogram at -717.91. The MACD line (1,471) sits below its signal (2,189). Price holds while momentum fades: a late-stage signature, not a reversal signal on its own.
- RSI at 56.55. Firm, not overheated: there is room in both directions.
- BTC dominance at 58.88% while the total crypto market cap is down 2.03% in 24 hours (about $2.646 trillion). Capital is rotating from altcoins into BTC — defensive positioning, not risk-on.
- Daily ATR at $2,077. A $2,000 swing in a single day is still on the table.
The box BTC is trading in
Pivot $77,390 · R1 $78,392 · S1 $76,781.
Bollinger mid-band $78,453, upper band $80,969, lower band $75,937.
Price sits just below the midline: not stretched, not compressed.
Short-term charts disagree with the daily
On the 1H chart the MACD histogram is positive (+79.04) and RSI is 62.45, with price pressing the upper band near $77,974. The daily is losing steam while the hourly is gaining it — typical of a larger trend pausing while short-term buyers test resistance. On the 15-minute chart the histogram has already slipped to -6.73.
Bullish scenario
A decisive daily close above R1 ($78,392) and the Bollinger midline ($78,453) opens the way toward the upper band near $80,969. Early tell: a reclaim of the 1H EMA200 around $77,865. Confirmation needed: the daily MACD histogram stops contracting. The Fear & Greed Index at 57 ("Greed") leaves some headroom before sentiment gets crowded.
Bearish scenario
Failing to hold the $77,390 pivot and breaking below S1 ($76,781) would point to the lower band at $75,937, with the EMA50 at $73,382 as the next magnet. The trigger to watch: a daily close below the EMA20 ($77,097). Outside the chart, a CNBC report on September 11 noted that Bitcoin's recent strength could be tested by a potential Clarity Act failure and Democratic midterm gains.
Bottom line
Structure bullish, momentum tired. The $77,390–$78,392 zone is the decision area: the first daily close outside it should show whether this is a pause or the start of a pullback. With a daily ATR above $2,000, either scenario can unfold quickly.
Full multi-timeframe analysis (daily, 1H and 15m) on The Cryptonomist:
https://en.cryptonomist.ch/2026/09/14/bitcoin-price-today-analysis-btcusdt/
This article is for informational purposes only and does not constitute financial advice. Crypto assets carry a high risk of capital loss. Always do your own research.
Article produced with the assistance of artificial intelligence and reviewed by the editorial team.