Key Takeaways 0.5 Fib, 50-month SMA, channel base align near $64,881. Bitcoin sits at $64,142.39 as July candle develops. Cardone Roadmap: Stair-step targets $55K, $52.5K, then $40,000 before
Key Takeaways
- 0.5 Fib, 50-month SMA, channel base align near $64,881.
- Bitcoin sits at $64,142.39 as July candle develops.
- Cardone Roadmap: Stair-step targets $55K, $52.5K, then $40,000 before November.
- Cardone Capital holds over 2,700 BTC across active funds.
- Monthly close above $64,881 or below $63,000 could resolve setup.
Where Price Is Sitting
Three long-term levels are stacked within a narrow band on the monthly chart shared by Filip Vantchev, owner of Coindoo, on July 10:
- The 0.5 Fibonacci retracement at $64,881.98, measured from the cycle low of $3,466.74 to the cycle high of $125,761.31.
- The 50-month simple moving average, which sits inside the same zone.
- The lower boundary of the long-term ascending channel drawn from the 2020 lows.
The current monthly candle prints around $64,100 at the time of writing, roughly $740 below the 0.5 Fib and touching the rising channel line for the first time this month. Monthly RSI reads 43.88, its lowest since the 2022 bottom range but not yet in oversold territory.
A confluence of this type is uncommon on a monthly timeframe. It does not, on its own, predict direction. It defines the level at which a decision has to be made.
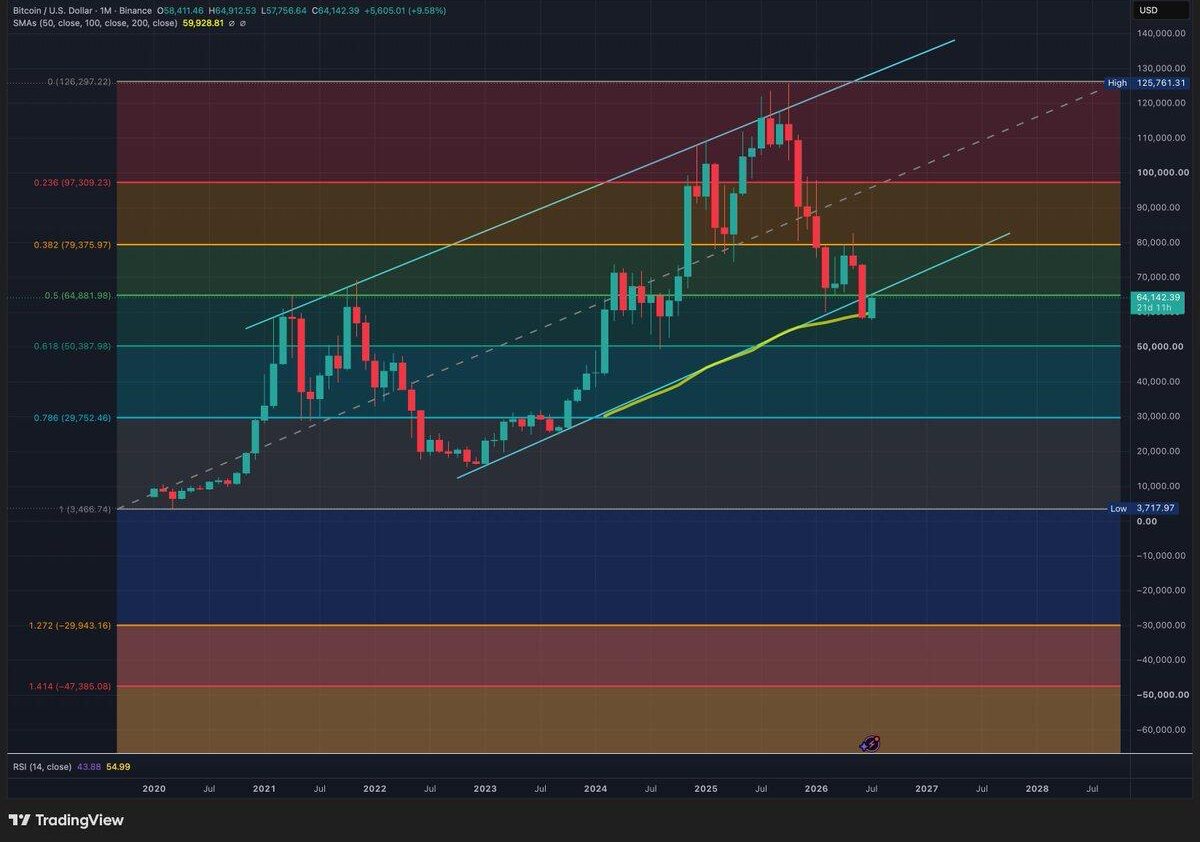
Monthly technical chart for BTC/USD, showcasing long-term price trends and key technical indicators.
The Bullish Reading of the Chart
A monthly close above the confluence could leave the ascending channel intact and preserve the 50-month SMA as dynamic support, a level Bitcoin has not lost through a monthly close in any completed cycle since 2015. In that scenario, the 0.382 Fibonacci at $79,375 becomes the first upside reference, followed by the prior cycle high near $126,000.
A close below the zone could break the channel, forfeit the 50-month SMA, and possibly open the 0.618 retracement at $50,387 as the next structural reference.
Cardone’s Case for a Deeper Flush
Grant Cardone, the founder of Cardone Capital, a private real estate investment firm managing a multifamily property portfolio across the United States, which now holds more than 2,700 BTC as part of a hybrid real estate and Bitcoin allocation model, rejected the idea that the current level marks the bottom. His argument is structured around a stair-step of lower supports rather than a single target.
I think we have to test $55K. We haven’t tested it yet, dude. We tested the lower low, so why would we not test another lower low? So test it, touch it. You know, I don’t care. If we touch $55K, we probably go check out $52K and a half. And if we check out $52K, we go on the $40,000s. So I think I will see $40,000 this year. In fact, I think I’ll see $40K before November.
In an interview shared by Altcoin Daily, he qualified the $40,000 print as a possible wick rather than a settlement zone:
In the 40s, you know, but that could be for one tick of a trade. I’m not saying it’s going to go and stay there.
The distinction matters. A tag of the $40,000s that is bought back the same session might not necessarily invalidate the long-term channel on a monthly closing basis, though it could break every intermediate support in the process.
Why He Wants the Move
The more revealing part of the commentary is Cardone’s stated preference for a fast washout over a prolonged sideways market:
I like price capitulation over time capitulation. Price capitulation doesn’t impact me. I’m not going to get a phone call. Y’all may get a phone call, but I’m not. And if I do get a phone call, I know what to do. What scares me is the time decay. Another six months of just sitting here with the money is just dead money.
The framing is that of a leveraged or opportunity-cost-sensitive allocator rather than a passive spot accumulator. For a manager running a 2,700-plus BTC position alongside a leveraged real estate book, a violent drawdown is a defined event that can be sized into and averaged down against. A range-bound market ties up capital without producing a resolution, and for positions financed against other assets, the carrying cost accrues regardless of price direction.
This is a market view rooted in position management, not a directional call on Bitcoin’s fundamentals.
Where the Two Views Meet
The chart and the Cardone thesis are not fully in conflict. The confluence zone is the level that has to hold to make his roadmap wrong. A monthly close beneath $64,000 that fails to reclaim on the following candle validates the path he described if the price breaks below the 50 SMA support: $55,000, then $52,500, then the $40,000s. Each of those numbers corresponds to a visible structural level, with the 0.618 Fib at $50,387 sitting directly between the second and third stop.
The reverse is equally clean. A monthly close above the 0.5 Fib that holds through a retest neutralizes the stair-step argument, because the mechanism Cardone describes, one broken support pulling price toward the next, requires the first support to break.
READ MORE:
 Bitcoin vs. Gold: Is the “Digital Gold” Thesis Breaking?
What Could Confirm Each Case
For the bullish structural case:
- A July or August monthly close above $64,880.
- A successful retest of the 50-month SMA without a monthly close beneath it.
- Monthly RSI reclaiming the 50 line from below.
For the Cardone path:
- A monthly close below $63,000, closing the channel breach.
- A monthly close below the 50-month SMA and retest confirmation.
- Continuation into the $55,000 area on weekly closes, which can remove the intermediate range floor.
The Risk on Both Sides
The confluence gives the bullish case an unusually well-defined invalidation line, which is a double-edged property. Levels that are visible to every chart-based trader tend to attract concentrated positioning, and a decisive break below such a level can accelerate into the next reference rather than stabilize at it. That mechanism is precisely the one Cardone is describing.
For the bearish case, the risk is symmetrical. If the monthly candle closes back inside the channel with the 50-month SMA defended, the same technical audience that would have chased a breakdown becomes the marginal bid on the way back up.
The next monthly close is the data point that probably would resolve the setup. Until then, both readings are internally consistent, and the disagreement is not about the chart but about which side of the confluence Bitcoin exits from.
The information provided in this article is for educational and informational purposes only and does not constitute financial, investment, or trading advice. Cryptocurrency markets are volatile and involve substantial risk. Readers should conduct their own research and consult with a qualified financial advisor before making any investment decisions.
The post Bitcoin at Critical Price Point: Bullish Setup or Bear Trap? appeared first on Coindoo.