Key Takeaways Fewer Bitcoin outputs remain at a loss. $71,300 marks potential active-supply cost-basis support. $79,800 concentrates possible break-even selling pressure. ETF withdrawals chal
Key Takeaways
- Fewer Bitcoin outputs remain at a loss.
- $71,300 marks potential active-supply cost-basis support.
- $79,800 concentrates possible break-even selling pressure.
- ETF withdrawals challenge the improving onchain picture.
Fewer losing outputs change the cycle picture
The share of Bitcoin transaction outputs held at a loss has fallen from close to 60% to approximately 27%, according to CryptoQuant contributor Crypto Dan. He argues that declines of a similar scale accompanied earlier transitions away from bearish market conditions.
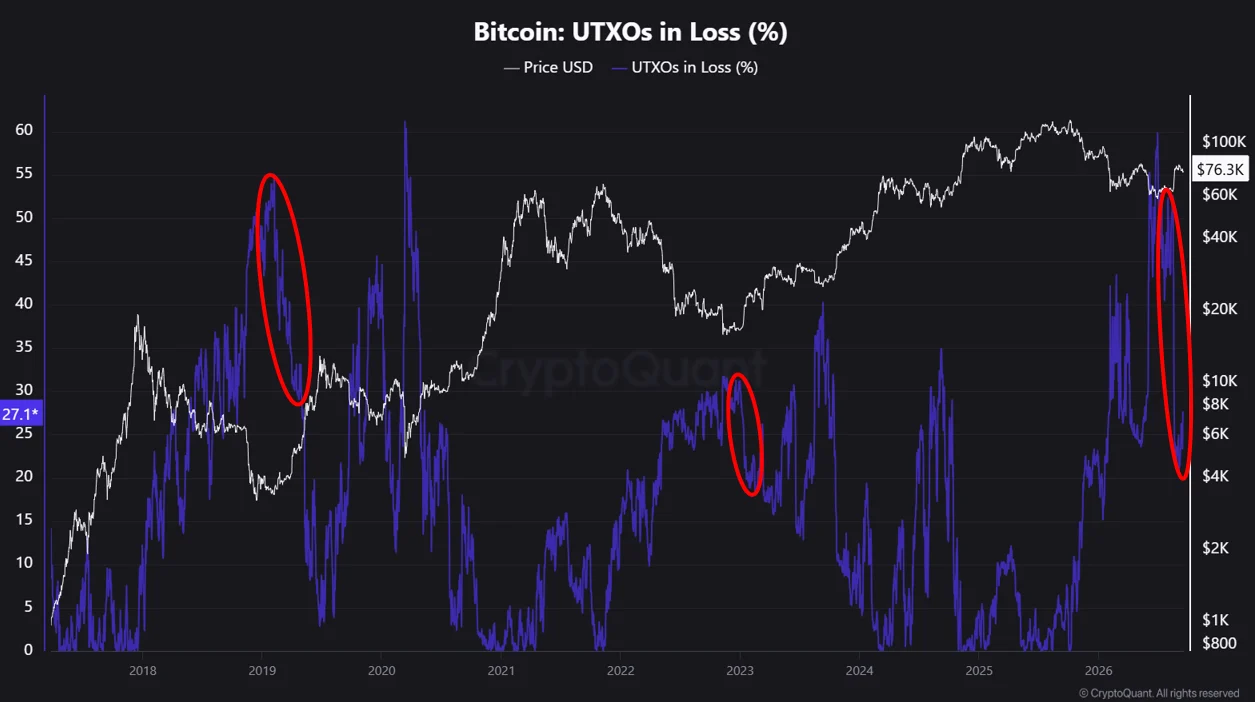
Bitcoin UTXOs in loss percentage metric.
A Bitcoin transaction output, or UTXO, is an individual piece of spendable BTC recorded on the blockchain. It is classified as being in loss when Bitcoin’s current price is below its implied cost basis, calculated from the market price when that output was created.
That does not necessarily identify the price paid by its current owner. A transaction can represent a purchase, but it can also be a transfer between wallets controlled by the same person or company.
The decline still shows that financial pressure has eased across a much larger number of Bitcoin outputs. Fewer of them now sit below their implied cost basis than at the height of the downturn.
It does not mean that 27% of Bitcoin investors are losing money. One person can control many UTXOs, while individual outputs can contain very different amounts of BTC. The metric counts blockchain outputs rather than people or an equal-weighted share of Bitcoin’s supply.
The historical comparison is also suggestive rather than conclusive because Bitcoin has completed only a small number of major market cycles. A lower loss percentage supports the recovery argument, but no single onchain metric officially determines when a bear cycle has ended.
A less likely return to a bear cycle also does not rule out another correction. The analysis concerns Bitcoin’s broader multi-month structure, not its next daily move.
Bitcoin remains between two groups of holders
The loss metric describes an improving market, but it does not show where buyers and sellers may react next. A separate analysis by CryptoQuant contributor Darkfost places Bitcoin between two cost-basis levels: potential active-supply support near $71,300 and invested-capital resistance around $79,800.
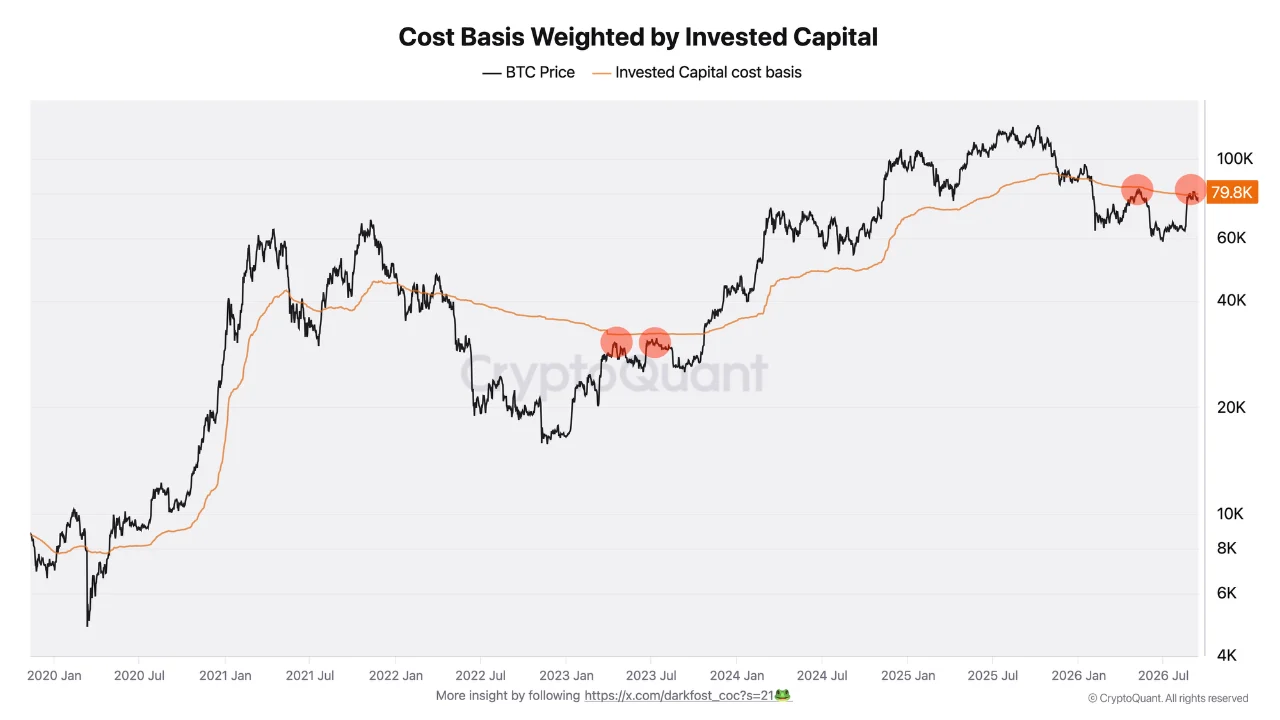
Bitcoin invested capital cost basis chart.
Bitcoin traded near $76,400 at 08:53 UTC on September 17, according to market data from CoinMarketCap checked at the time of writing. That placed the price approximately 7% above the lower boundary and 4% below the upper one.
The range turns Crypto Dan’s wider cycle argument into a testable price structure. Bitcoin has recovered enough to keep active holders broadly profitable, but not enough to absorb all the supply waiting near break-even.
$71,300 reflects the cost basis of active Bitcoin
The active-supply cost basis estimates the average price of coins that remain economically relevant to the current market. Bitcoin that has not moved for more than seven years is excluded, reducing the influence of holdings that may be lost, inaccessible or unlikely to participate.
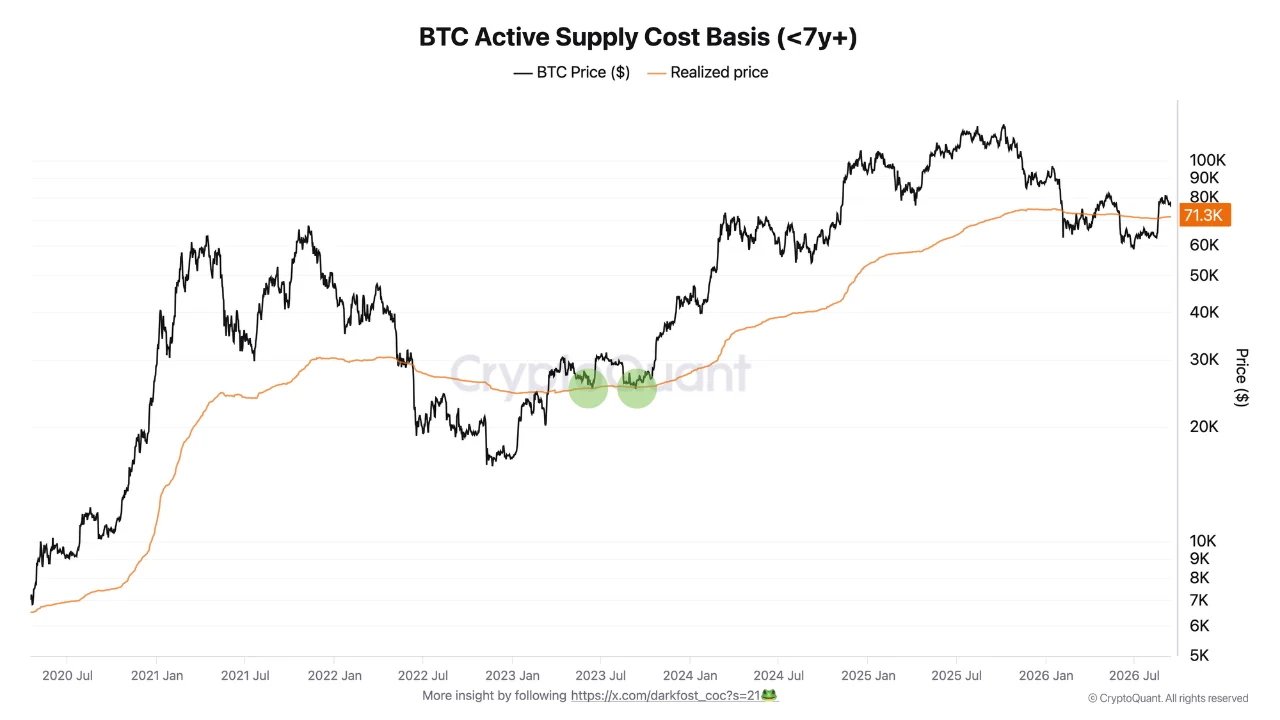
Bitcoin active supply cost basis chart.
Bitcoin trading above approximately $71,300 means the average coin included in this group remains in profit. Investors whose cost basis is nearby may resist selling below it, helping the area behave as support when price returns.
That behaviour is not guaranteed. A sustained move below $71,300 would place more active supply underwater. If buyers failed to reclaim the level, investors trying to avoid deeper losses could turn the former support into a source of selling.
$79,800 is where the recovery meets sellers
The invested-capital cost basis near $79,800 represents a different group. At that level, some capital currently held at a loss returns to break-even.
Investors who bought at higher prices may use the recovery to exit without realizing a loss. More recent buyers may also take profits in the same area. Those decisions can add supply near $79,800 and help explain why Bitcoin has struggled to advance through it.
This does not contradict the falling percentage of losing outputs. The same recovery that brings more UTXOs back into profit also moves previously underwater holders closer to an exit. Bitcoin must absorb their potential selling before the improving onchain structure can translate into a sustained move higher.
How to read Bitcoin’s cost-basis range
Above $79,800Holding above the upper boundary would show that demand can absorb potential break-even selling.
Between $71,300 and $79,800Active supply remains broadly profitable, but overhead selling continues to restrict the recovery.
Below $71,300A sustained break would place more active supply in loss and weaken the improving cycle structure.
The loss percentage can reverse with price
The main counterargument is built into the UTXO indicator itself. Its improvement is partly a consequence of Bitcoin’s recovery. When the price rises, outputs automatically move from loss into profit; when it falls, that process reverses.
The metric therefore confirms that conditions have improved, but it cannot independently show whether demand is strong enough to maintain that improvement. The cost-basis range and capital entering or leaving the market provide the necessary second test.
Recent fund flows are less supportive. U.S. spot Bitcoin ETFs recorded approximately $450 million in net withdrawals on September 15, according to SoSoValue data, their largest daily outflow since June.
The withdrawals occurred on the day the CLARITY Act failed to advance in the Senate. One day later, the Federal Reserve raised interest rates by 25 basis points. The timing does not prove that either event caused the redemptions, but both developments created a more difficult backdrop for risk-sensitive demand.
Higher rates can make speculative assets less attractive, although Bitcoin has not responded identically to every tightening decision. Its past reactions to Federal Reserve rate increases depended on whether the policy change had already been priced in and what officials signalled next.
READ MORE:
 Zcash Flips Hyperliquid After 2,500% Rally – Can $1,300 Hold?
The next pullback will test the cycle argument
The bullish case does not require Bitcoin to rise without interruption. It requires future declines to leave the percentage of losing outputs relatively contained while active-supply cost basis continues to hold. Stabilizing ETF demand would provide additional evidence that the improvement is supported by new capital rather than price recovery alone.
The opposing case would strengthen if Bitcoin remained below its active-supply cost basis, the share of losing outputs began rising sharply and fund withdrawals continued. That combination would show that the recovery had failed to protect holders once demand weakened.
Crypto Dan’s metric suggests that Bitcoin no longer carries the same level of widespread unrealized stress seen earlier in the downturn. Darkfost’s range identifies what remains unresolved: the market has recovered enough to create potential support, but not yet enough to absorb all the capital waiting to exit near break-even.
This article is provided for informational purposes only and does not constitute financial or investment advice. Onchain indicators and historical market patterns do not guarantee future price performance.
The post Bitcoin Bear-Cycle Return Looks Less Likely: CryptoQuant Analyst appeared first on Coindoo.