Bitcoin breakout pressure is building as rising support meets descending resistance, with MACD and RSI showing modest bullish momentum. BlackRock-related Bitcoin transfers add institutional c
- Bitcoin breakout pressure is building as rising support meets descending resistance, with MACD and RSI showing modest bullish momentum.
- BlackRock-related Bitcoin transfers add institutional context as the market approaches a decisive 4-hour technical resistance zone.
- Rising support and positive momentum keep Bitcoin constructive, but weak volume leaves the triangle breakout without confirmation.
Bitcoin breakout conditions are tightening as institutional flows continue, while a compressed 4-hour structure leaves the market positioned near descending resistance and rising support ahead of a decisive directional move.
Institutional Bitcoin Flows Add Weight to Market Structure
Onchain Lens reported 7.32K BTC accumulated through BlackRock's IBIT this week. The reported value reached approximately $478.5 million across the transfers. A separate 1.84K BTC movement represented roughly $118.9 million.
https://twitter.com/OnchainLens/status/2085886219897204850?s=20
The transfers moved from Coinbase Prime into wallets labeled for BlackRock's IBIT ETF. Several transactions appear in the supplied wallet activity, showing repeated custody movements. However, wallet transfers alone cannot establish the exact purpose behind each transaction.
The activity still provides useful context for Bitcoin's current market structure. Sustained transfers can reflect custody changes, settlement activity, or institutional positioning. Therefore, the weekly total carries more weight than any single transaction.
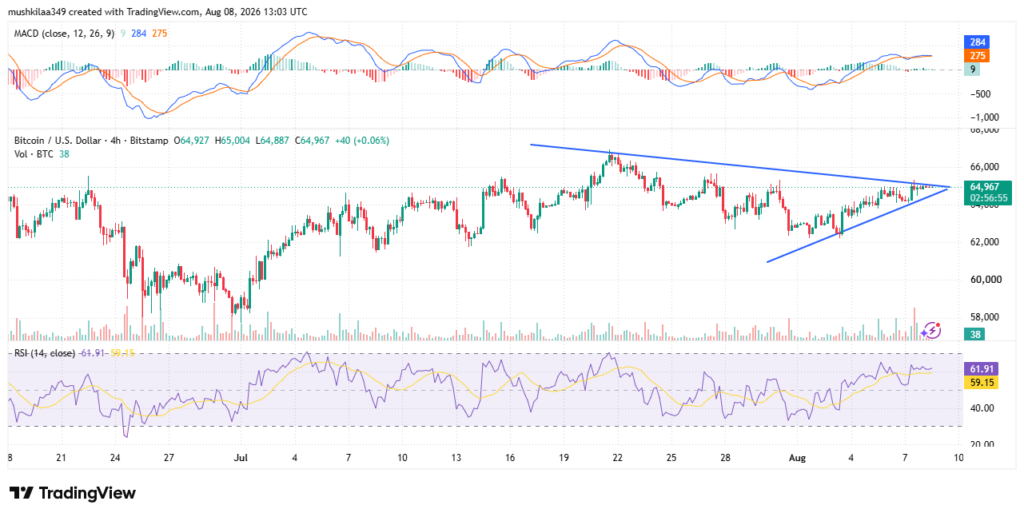
The latest market setup places these flows against a compressed technical range. Bitcoin is trading around $64,964 on the supplied four-hour chart. Price remains close to the meeting point between both trendlines.
Four-Hour Triangle Keeps Price Near Decision Point
The chart shows descending resistance extending from the July peak near $68,000. Meanwhile, rising support begins around the $61,000 region and advances toward current levels. These opposing lines have steadily narrowed the trading range.
Source:
TradingViewBitcoin has formed higher lows during the latest recovery phase. Yet successive rebounds have struggled beneath the descending resistance line. That combination keeps the structure neutral until either boundary breaks decisively.

A move above resistance would change the short-term structure materially. The July swing area around $66,000 could then become the next reference zone.On the other hand, a loss of support would bring back the $62,000-$63,000 zone.
The pattern is towards the top of the cycle and a bigger move is becoming more likely. However, the chart does not confirm direction before a breakout occurs. Price action and volume therefore remain central to the next technical signal.
Momentum Improves While Volume Remains Crucial
The MACD line is located around 284, and the signal line is around 275. The momentum is also slightly positive with a histogram as well. Still, the narrow spread shows limited bullish acceleration.
RSI stands near 61.86, while its moving average remains around 59.15. That places momentum above neutral without reaching traditionally stretched conditions. The indicator therefore leaves room for additional upside if buying pressure expands.
Volume has not yet shown a decisive expansion accompanying the tightening structure. A resistance break supported by stronger participation would provide better confirmation. Conversely, weak volume could leave the price vulnerable to another rejection.
For now, the market remains compressed between rising and falling trendlines. Institutional transfers provide supportive context, while momentum indicators lean modestly constructive. The next sustained move should determine whether buyers can finally clear overhead resistance.