Bitcoin’s recovery from an early decline faces a crucial test today, October 30, as gold moves closer to an important support area. Both assets remain under pressure, although their indicator
Bitcoin’s recovery from an early decline faces a crucial test today, October 30, as gold moves closer to an important support area. Both assets remain under pressure, although their indicators offer different clues about the possibility of a rebound.
The Bitcoin price prediction depends on whether its recovery can clear resistance and hold above it. Gold’s outlook centres on whether support can absorb further selling before buyers attempt to recover lost ground.
Bitcoin Price Recovery Faces A Crucial Test At $78,200
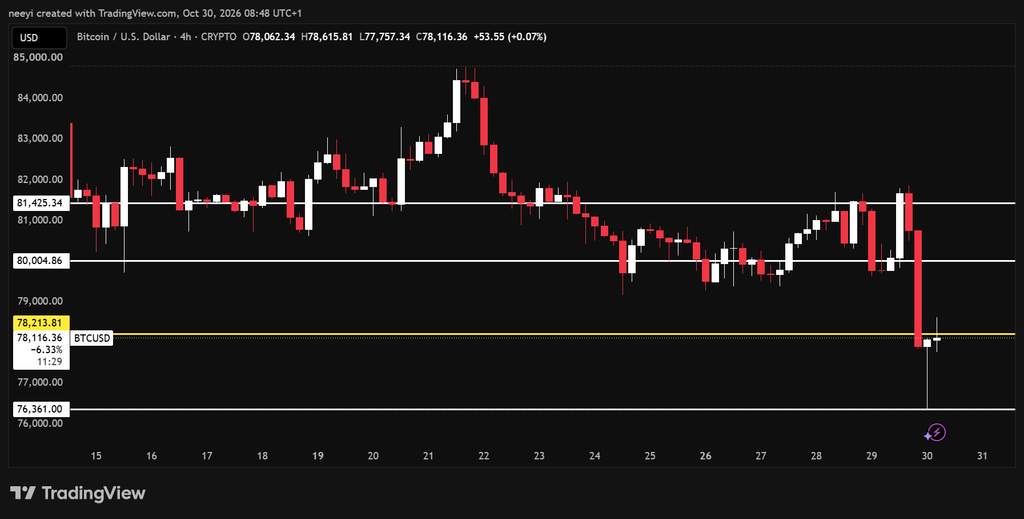
Bitcoin declined toward $76,000 earlier today before recovering to approximately $78,000. That rebound brought BTC close to $78,200, the level that could determine whether the recovery continues or fades.
The distinction between resistance and support matters here. Bitcoin must first break above $78,200 before that level can become support. A recovery toward this barrier alone does not confirm that buyers have regained control.
BTC Price Chart / TradingView.com
A sustained move above $78,200 would open the route toward $79,000 and $80,000. Stronger buying could extend the recovery toward $81,000, with $81,400 representing the upper target in the supplied outlook.
Failure to clear $78,200 would leave Bitcoin vulnerable to another test of $76,000. A break below that earlier low would bring $75,000 into focus.
The early decline therefore remains relevant despite the rebound. Bitcoin needs to hold its recovery through a resistance test before the broader intraday picture becomes more constructive.
Bitcoin Indicators Show A Rebound Against Continued Bearish Pressure
RSI(14) reads 42.784, below the midpoint of 50. This indicates that bearish momentum still has the advantage despite Bitcoin’s recovery. A move toward 50 would strengthen the case for a successful test of $78,200.
Stochastic(9,6) reads 73.372, which supports the presence of a short term rebound. However, this reading measures price relative to its recent range and does not independently confirm a lasting recovery. Its contrast with RSI helps explain why BTC can rise without removing the broader bearish pressure.
MACD(12,26) reads −619.527, which places the indicator below zero. The negative reading supports a cautious interpretation of the rebound, although the signal line and histogram would be needed to assess whether momentum is improving.
Highs/Lows(14) reads −205.7950, consistent with continued weakness relative to its recent price reference. This adds another reason to watch how Bitcoin behaves near resistance before treating the bounce as a stronger recovery.
Bull/Bear Power(13) reads −219.1404, which supports the view that sellers retain an advantage. Buyers would need sustained progress above $78,200 to challenge that condition.
Indicator
Value
Action Interpretation
RSI(14)
42.784
Momentum remains below the neutral midpoint.
STOCH(9,6)
73.372
The rebound has short term momentum.
MACD(12,26)
−619.527
Negative momentum remains a recovery obstacle.
Highs/Lows(14)
−205.7950
Recent price pressure remains broadly negative.
Bull/Bear Power(13)
−219.1404
Sellers retain the stronger overall position.
Bitcoin Price Prediction For Today: Bullish, Neutral And Bearish Scenarios
- Bullish scenario: Bitcoin breaks above $78,200 and holds that level during a retest. The next targets become $79,000 and $80,000, followed by $81,000 to $81,400 if buying strengthens.
- Neutral scenario: Bitcoin remains between $76,000 and $78,200, with repeated resistance tests but no sustained breakout.
- Bearish scenario: Rejection around $78,200 sends BTC back toward $76,000. Failure to defend that support opens the possibility of $75,000.
Gold Price Nears $3,970 Support After Another Decline
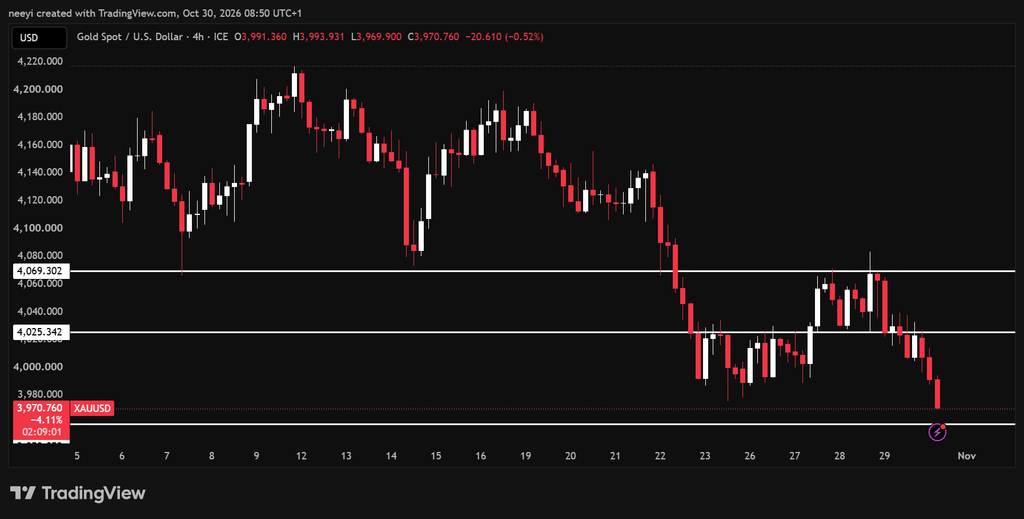
Gold also retains a bearish intraday structure after extending its decline from yesterday. The chart places the opening near $4,020, the session high around $4,027, and the low close to $3,980.
That puts gold within reach of the $3,970 support identified in the supplied analysis. The same account describes previous defences around this area on October 23 and October 26, alongside earlier tests during June and July.
XAUUSD Price Chart / TradingView.com
Those previous reactions make the area relevant, although repeated tests cannot guarantee another successful defence. Continued pressure could eventually exhaust the demand that previously supported the price.
The immediate downside area therefore extends from $3,970 to $3,960. A rebound from this zone would face its first meaningful test around $3,990.
Recovery above $3,990 would improve the prospect of a move toward $4,000 and then $4,020. An extension toward $4,030 remains possible under stronger buying conditions, although it represents the more optimistic outcome.
Gold Indicators Leave Room For A Bounce Without Confirming Recovery
RSI(14) reads 30.761, close to the conventional oversold threshold of 30. Gold is under substantial downward pressure, but this reading alone cannot establish that a bottom has formed.
Stochastic(9,6) reads 6.706, deep within oversold territory. This creates room for a technical rebound near $3,970 to $3,960, although the indicator can remain depressed during a persistent decline.
MACD(12,26) reads −12.251, consistent with negative momentum. Gold would need more convincing price strength before a bounce could support a broader recovery argument.
Highs/Lows(14) reads −23.6200, which reinforces the weakness visible in the price action. A recovery through $3,990 would provide a useful initial sign that this pressure is easing.
Bull/Bear Power(13) reads −33.1559, another indication that sellers retain control. This makes the support response especially important for today’s gold price prediction.
Indicator
Value
Action Interpretation
RSI(14)
30.761
Momentum is weak and near oversold territory.
STOCH(9,6)
6.706
Deep oversold conditions allow rebound potential.
MACD(12,26)
−12.251
Negative momentum continues to restrict recovery.
Highs/Lows(14)
−23.6200
Recent price weakness remains evident.
Bull/Bear Power(13)
−33.1559
Sellers maintain the stronger overall position.
Gold Price Prediction For Today: Bullish, Neutral And Bearish Scenarios
- Bullish scenario: Gold defends $3,970 to $3,960 and recovers above $3,990. The next levels become $4,000 and $4,020, with $4,030 requiring stronger demand.
- Neutral scenario: Gold trades between $3,970 and $4,020, with $3,990 acting as the central recovery test.
- Bearish scenario: Gold breaks below $3,970 and tests $3,960. Continued weakness below that area would invalidate the proposed support bounce.
Subscribe to our YouTube channel for daily crypto updates, market insights, and expert analysis.
The post Bitcoin (BTC) and Gold Price Predictions for Today, October 30 appeared first on CaptainAltcoin.