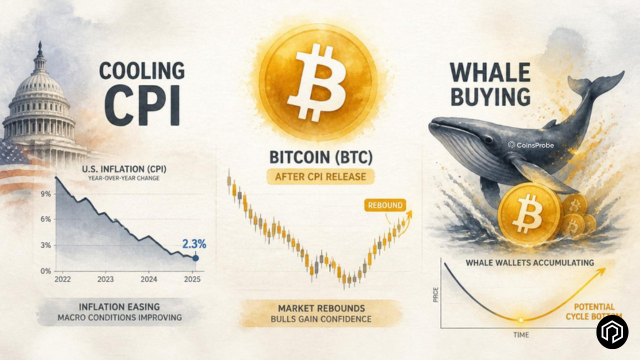
Key Highlights Bitcoin is trading at $64,656.89, up 3.06% over 30 days, with a $1.29T market cap, showing resilience after cooler US CPI data. A prominent whale has opened a 1,660 BTC (~$107.
Key Highlights
- Bitcoin is trading at $64,656.89, up 3.06% over 30 days, with a $1.29T market cap, showing resilience after cooler US CPI data.
- A prominent whale has opened a 1,660 BTC (~$107.4M) long position on Hyperliquid, signaling strong confidence in a near-term rebound.
- Analyst notes the current weekly bullish divergence closely mirrors the setup that preceded Bitcoin's 2022 cycle bottom.
- The $60K–$64K range is viewed as a key accumulation zone, with deeper pullbacks seen as buying opportunities.
Bitcoin is currently trading at $64,656.89, with a market capitalization of $1.29 trillion. Over the past 30 days, BTC has posted a modest gain of +3.06%, demonstrating some resilience following cooler-than-expected CPI data. However, the broader picture remains corrective, with Bitcoin down 26.12% year-to-date after a significant decline from its all-time high near $126,000 (reached around October 2025).
The recent price action suggests the market is attempting to find a floor after the sharp pullback from the 2025 peak.
 Bitcoin BTC Price on 19 July 2026/Source:/Source: Coinmarketcap
Signal 1 — Whale Builds $107M Leveraged Long on Hyperliquid
Lookonchain has identified a prominent whale that has been steadily and persistently building a leveraged long Bitcoin position on Hyperliquid — the same platform we covered in our Hyperliquid Portfolio Margin Beta expansion article as one of the most significant institutional-grade DeFi trading venues in 2026.
 Whale 0x66f8 BTC long/Source: @lookonchain (X)
Why this position is significant:
A 1,660 BTC long worth $107.36 million is not a speculative retail trade — it is a deliberate, large-scale institutional commitment to Bitcoin’s upside at current price levels. The liquidation price at $63,123 is particularly notable because of how close it sits to the current price of $64,656 — this whale is not positioning with excessive cushion, but rather with high conviction that Bitcoin will not revisit the $63,123 level before moving higher.
The fact that this position has been steadily increasing — Lookonchain confirms this whale has been adding exposure on dips rather than entering in a single transaction — reflects the kind of systematic, conviction-driven accumulation that distinguishes informed institutional positioning from short-term speculative trades.
Large leveraged long positions of this scale create a specific market dynamic: the whale has a direct financial incentive to defend the $63,123 liquidation level, which adds a layer of buy-side support at and near that price that operates independently of general market sentiment.
As we covered in our Bitcoin ETF inflows and 4,000 new whale wallets article — institutional-scale accumulation at current levels has been one of the most consistent on-chain signals of the current period, and this $107M Hyperliquid position is the most concentrated single expression of that trend.
Signal 2 — The 2022 Cycle Comparison: 147 Days vs 161 Days
Analyst @gumsays identified a specific and historically grounded comparison between the current 2026 Bitcoin setup and the 2022 cycle bottom — and the precision of the parallel makes it worth examining carefully.
What happened in 2022:
A bullish divergence appeared on Bitcoin’s weekly chart — a signal where price makes a new low while the RSI or momentum indicator makes a higher low, indicating that selling pressure is weakening even as price continues declining. In 2022, this weekly divergence appeared 161 days before Bitcoin’s ultimate cycle bottom was confirmed and the recovery phase began.
What is happening in 2026:
An identical bullish divergence has formed on Bitcoin’s weekly chart in the current cycle. As of today’s date — July 18, 2026 — it has been 147 days since that divergence signal appeared.
 Bitcoin BTC Weekly Chart/Credits & Source: @gumsays (X)
The comparison:
CycleDivergence AppearedDays to Bottom Confirmation2022Weekly bullish divergence161 days2026 (current)Weekly bullish divergence147 days (so far)
The current cycle is 14 days behind the 2022 timeline — meaning if the parallel holds precisely, the cycle bottom confirmation could arrive within approximately two weeks from today.
The important nuance @gumsays highlights:
Both the 2022 instance and the current signal involved the divergence eventually resolving with one final new low that acted as the ultimate cycle bottom — before the recovery began in earnest. This means the pattern suggests not necessarily a straight-line recovery from here, but a potential final capitulation move to a new low followed by the actual bottom and recovery.
This is consistent with the pattern we documented in our 45% of LTH supply in loss article — where the unresolved MVRV realised price retest near $50,000–$55,000 remains the one historical pattern that prior cycles completed before their final recovery began.
Accumulation Framework
Rather than advocating for a single precise bottom-tick entry — which the analysis explicitly acknowledges cannot be reliably timed — @gumsays provides a practical accumulation framework based on the cycle comparison:
Primary accumulation zone: $60,000–$64,000
The current price range offers what the analyst characterises as a strong risk-reward entry for the next major bull cycle — supported by the 147-day bullish divergence, the whale accumulation data, and the macro tailwind from cooling inflation.
Secondary opportunity: ~$45,000
If Bitcoin experiences the final new low that the pattern historically produces before confirming the bottom — a test toward the $45,000 area would represent an even stronger accumulation opportunity rather than a signal to exit. @gumsays frames this level explicitly as a potential add point rather than a reason for concern.
The strategic logic: A blended average between accumulation at $60,000–$64,000 and a potential add near $45,000 would produce a cost basis in the high $50,000s — a level that, in the context of prior Bitcoin cycles, has historically offered substantial long-term returns from comparable accumulation zones.
Bottom Line
Bitcoin at $64,656 is presenting a convergence of three independent signals all pointing toward the same conclusion — a late-stage bottoming process rather than the continuation of an open-ended decline. A $107M whale building a leveraged long with a $63,123 liquidation floor. A 147-day weekly bullish divergence that mirrors the 2022 signal that appeared 161 days before that cycle’s confirmed bottom. And macro conditions — cooler CPI, improving inflation trajectory — removing the most persistent headwind that has suppressed risk appetite throughout 2026.
None of these signals guarantee a specific price or a specific date for the bottom. @gumsays’ framework is the most practical takeaway: accumulating in the $60,000–$64,000 zone and treating any weakness toward $45,000 as an opportunity rather than a threat is a historically grounded approach to the current setup — one that does not require perfect timing to produce a strong long-term entry.
The $63,123 whale liquidation level is the near-term risk to watch. Everything above it keeps the constructive picture intact.
Disclaimer: The views and analysis presented in this article are for informational purposes only and reflect the author’s perspective, not financial advice. Technical patterns and indicators discussed are subject to market volatility and may or may not yield anticipated results. Investors are advised to exercise caution, conduct independent research, and make decisions aligned with their individual risk tolerance.
Read Also: DeXe (DEXE) Surged 1,000% This Year — Could a 90% Correction Be Next?