Key Highlights Bitcoin surged past $86,000, reaching an intraday peak close to $86,885. BTC faces critical resistance between $86,500 and $87,000 as the daily uptrend remains strong. Spot Bit
Key Highlights
- Bitcoin surged past $86,000, reaching an intraday peak close to $86,885.
- BTC faces critical resistance between $86,500 and $87,000 as the daily uptrend remains strong.
- Spot Bitcoin ETFs in the United States recorded approximately $3.1 billion in inflows over nine consecutive days.
- The positive streak concluded with $148.7 million in net outflows, primarily from Fidelity’s FBTC.
- Citibank revised its 12-month BTC price projection upward from $82,000 to $113,000.
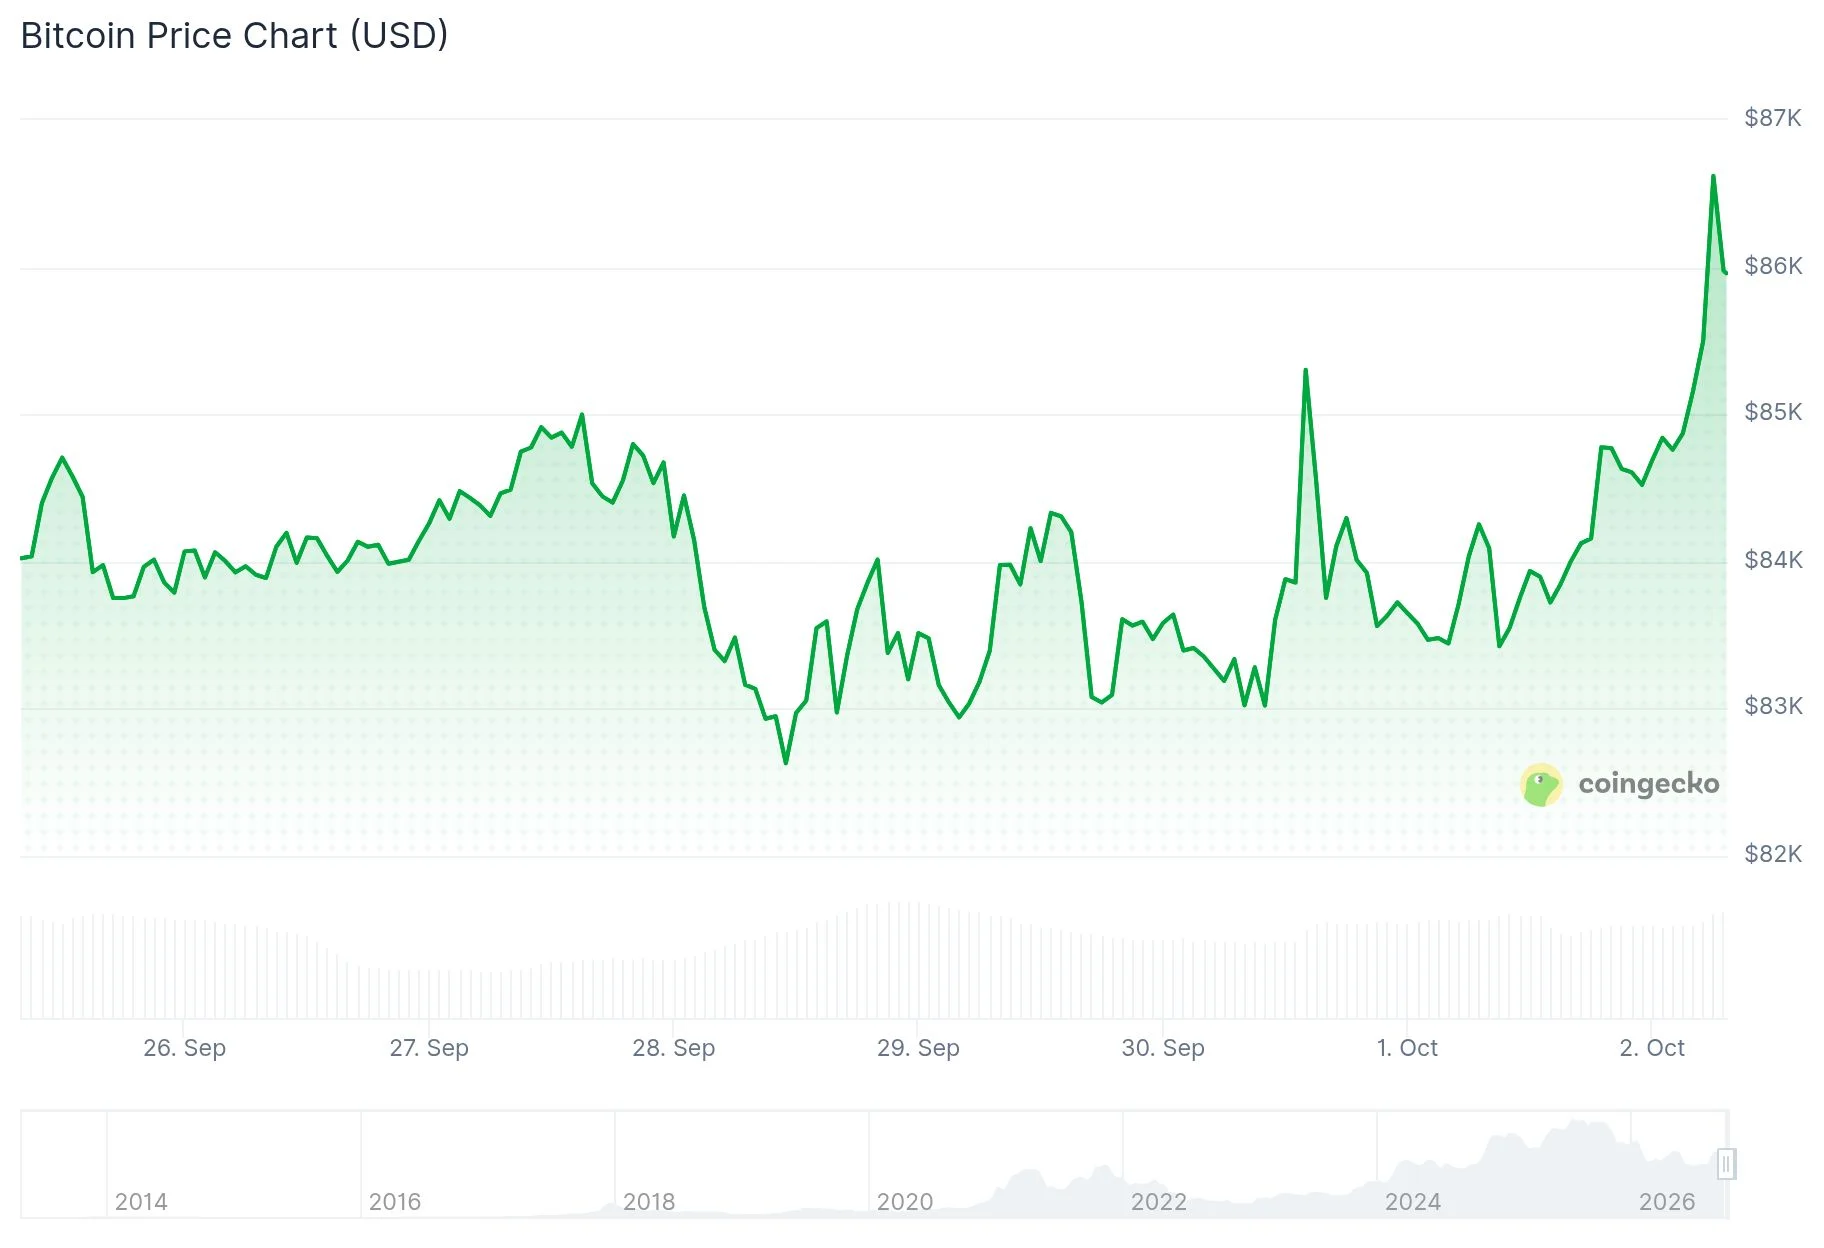
Bitcoin (BTC) recaptured the $86,000 level on Friday as buying momentum returned to the cryptocurrency market. The digital asset pushed into a resistance area that previously halted upward movement in September.
 Bitcoin (BTC) Price
Trading began near $84,849 before BTC rallied to an intraday peak of $86,885.
At press time, Bitcoin was changing hands around $86,266, representing approximately 1.7% daily gains.
The latest advance brings Bitcoin within striking distance of the September highs. During that period, BTC momentarily crossed $87,000 before retreating toward the $82,000 mark.
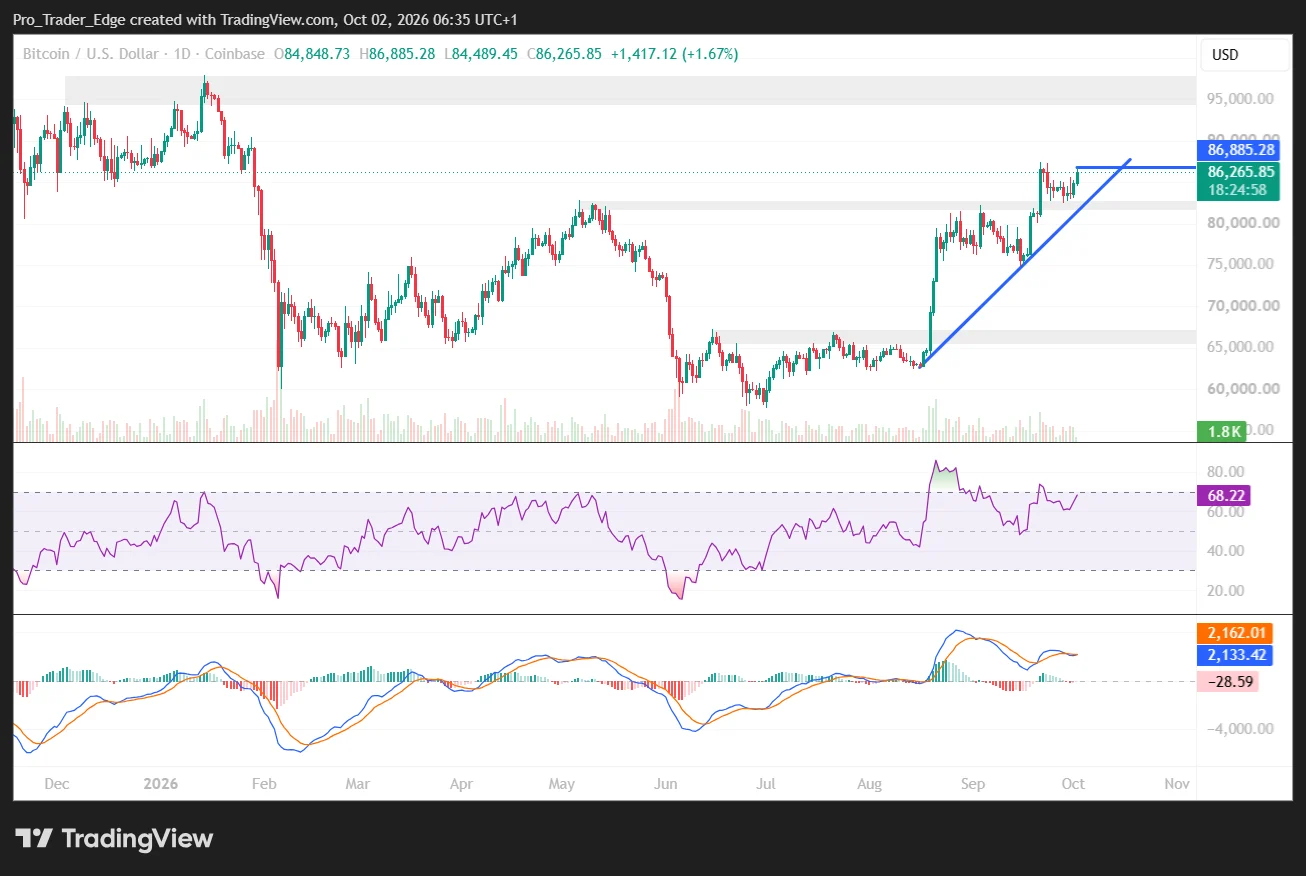
Technical indicators on the daily timeframe continue displaying bullish structure. Since August lows around $63,000, price action has established a pattern of ascending lows.
Market analyst Bull Theory highlighted the speed of the market reaction. According to the analyst, Bitcoin’s recapture of $86,000 resulted in $120 million worth of short position liquidations in just 60 minutes, while the overall cryptocurrency market capitalization expanded by $40 billion during the same period.
Critical Resistance Zone at $87K
The immediate battleground centers on the $86,500 to $87,000 price range.
Bitcoin has struggled to maintain levels above this threshold on multiple occasions in recent trading sessions. A sustained daily close above this zone would signal strength for the current bullish attempt.
Source: TradingView
Should BTC successfully breach $87,000, the chart reveals minimal resistance until the $94,000-$97,000 range. This upper zone served as a ceiling during late 2025 and early 2026 trading.
On the downside, immediate support is positioned near $82,000-$83,000. The broader $80,000-$82,000 range would likely come into play if the current rally loses steam.
The daily Relative Strength Index currently stands at 68.22, approaching the 70 threshold that technical analysts commonly associate with overbought territory.
Meanwhile, the MACD indicator shows the main line at approximately 2,133, trailing the signal line at 2,162. The histogram displays a modest negative reading of around -29, suggesting momentum confirmation remains incomplete.
Trader Ted Pillows analyzed the buying activity supporting the rally. According to his assessment, spot market demand for Bitcoin showed notable strength throughout the trading session, with a confirmed hold above $86,000 potentially shifting control decisively to buyers.
Institutional Capital Returns to Bitcoin ETFs
The institutional investment narrative continues shaping Bitcoin’s recovery trajectory.
United States-based spot Bitcoin exchange-traded funds accumulated nearly $3.1 billion throughout nine consecutive sessions of positive net inflows. This impressive run concluded on September 30.
Following the streak, the products registered $148.7 million in net redemptions. Fidelity’s FBTC experienced the largest withdrawals at $125.6 million, with Bitwise’s BITB and BlackRock’s IBIT also seeing outflows.
Despite the single-day reversal, quarterly performance remains robust. Bitcoin ETFs attracted approximately $6.34 billion during the third quarter, with September contributing roughly $2.65 billion of that total.
These inflows have reversed 2026’s ETF trend into positive territory following significant outflows during the summer months.
Citibank analysts upgraded their 12-month Bitcoin price forecast from $82,000 to $113,000 earlier this week. The revision reflects increased cryptocurrency market activity, more favorable macroeconomic conditions, and the resumption of ETF capital inflows.
Federal Reserve policymakers have indicated they may adopt a wait-and-see approach before implementing additional rate adjustments in October. Meanwhile, U.S. Treasury yields continue hovering near levels last seen multiple decades ago.
Bitcoin has successfully reclaimed the $86,000 level with the daily uptrend structure intact. Bulls are now challenging the $86,500-$87,000 resistance ceiling after regaining this psychological level during the current trading session.
The post Bitcoin (BTC) Surges Past $86K as Citi Projects $113,000 Price Target Within 12 Months appeared first on Blockonomi.