Bitcoin price today is trading close to $64,175, holding steady after weeks of choppy, sideways action. The coin has spent most of July stuck under $65,000, and traders are watching closely f
Bitcoin price today is trading close to $64,175, holding steady after weeks of choppy, sideways action. The coin has spent most of July stuck under $65,000, and traders are watching closely for a breakout in either direction.
A fresh signal on the weekly chart has caught the attention of chart watchers.
The last time this same pattern showed up, $BTC price went on to rally more than 700%. Now it's back, and people are paying attention.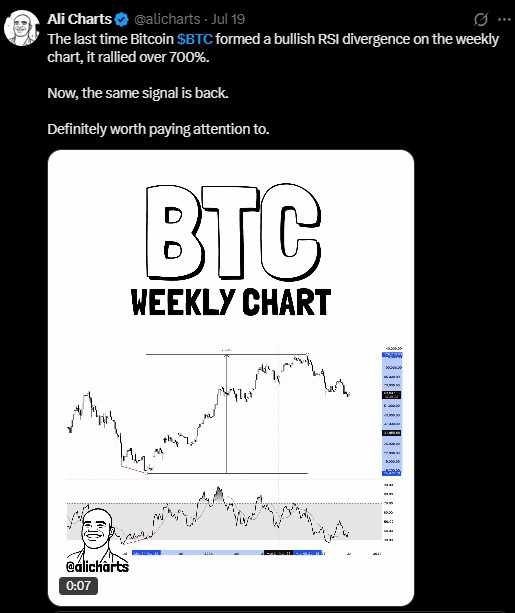
What is the Bitcoin price today?
As of July 20, 2026, $BTC trades around $64,129 to $64,944, based on daily chart data. The coin is down slightly on the day, moving inside a narrow range between $63,600 and $65,600.
The daily chart shows BTC stuck below its 50, 100, and 200-day moving averages, which sit at $63,642, $68,069, and $74,004.
That stacking shows the broader trend is still tilted down, even though short-term price action looks calm.
RSI on the daily chart sits at 52.02, right in the middle of neutral territory. That means Bitcoin isn't overbought or oversold at the moment. It's simply waiting.
What is a bullish RSI divergence in Bitcoin trading?
A bullish RSI divergence happens when price makes a lower low, but the RSI indicator makes a higher low. It's a signal that selling pressure is fading, even if price hasn't turned around yet.
According to chart analyst Ali Charts, the last time this setup appeared on Bitcoin's weekly chart, price rallied more than 700% afterward.
That same pattern has now reappeared, which is why it's drawing attention across crypto social media.
To be clear, no signal guarantees a repeat performance. Markets change, and past patterns don't always play out the same way twice. But historically, this has been one of the more reliable early warning signs for Bitcoin bulls.
Will Bitcoin go up? What past bear markets show
Bitcoin has only dropped below the prior cycle's all-time high a handful of times in its history. Each time, it turned into a strong long-term buying zone.
Cycle
Previous ATH
What Happened Next
Resulting Rally
2015
~$259
BTC fell below this level in the 2014-15 bear market
Rallied over 7,500% next cycle
2022
~$19,660
BTC dropped below this level in late 2022
Rallied over 550% to $126,198 by October 2025
2026 (current)
~$69,000
BTC has traded below this level since June 2026
Outcome still unfolding
According to chart analyst Ali Charts, the pattern is simple. Bitcoin dips under the old cycle high, scares off short-term traders, and then buyers who accumulated near that zone are rewarded once momentum shifts back up.
If the price can climb back above $69,000 and hold that level as support, it would echo those earlier setups. That would be one more piece of evidence that a new uptrend may already be forming.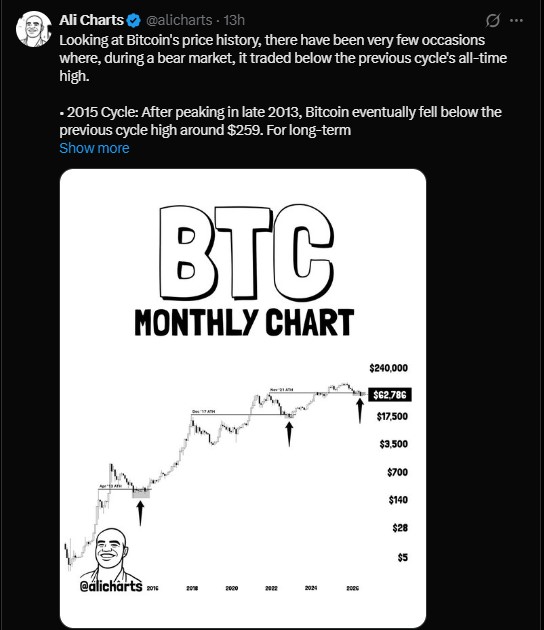
How much Bitcoin does Michael Saylor's Strategy own?
Strategy Inc., led by Michael Saylor, remains the largest corporate holder of Bitcoin. The firm holds 843,775 BTC, worth about $54.13 billion as of July 20, 2026.
That stash sits at an average cost of $75,653 per coin, meaning the company is currently down around 15.2%, or roughly $9.7 billion in unrealized losses at today's prices.
Strategy bought aggressively earlier in 2026, picking up as much as 34,164 BTC in a single month back in April.
That pace slowed considerably by June, and the firm even sold a small amount, around 2,225 BTC on June 30, partly to help fund dividend payments and build up a cash reserve near $2.55 billion.
On Sunday, Saylor posted a simple two-word question on social media: "What's next?" alongside a chart of the firm's Bitcoin holdings.
The post has fueled speculation that a new SEC filing could reveal fresh purchases, though it's just as possible it points toward more cash-raising instead.
Markets are split on which way this goes. Some see it as a signal Strategy is about to buy the dip. Others think the firm is simply managing its balance sheet during a rough patch.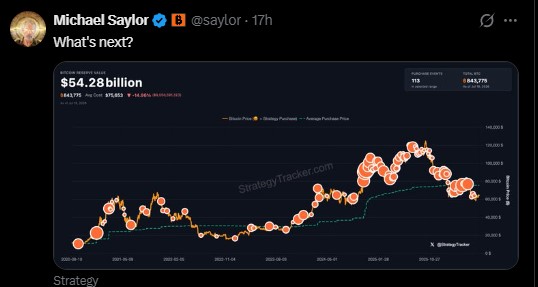
Bitcoin price prediction 2026: what's the next key level?
The $69,000 mark stands out as the level to watch. It represents the old cycle high from 2021, and reclaiming it as support has historically marked the shift from bear market to bull trend.
On the downside, the daily chart shows a pattern forming since early June, with support trendlines currently near $63,000 to $64,000.
A break below that zone could open the door to further downside before any recovery attempt.
For now, BTC price sits in a holding pattern. The weekly RSI divergence offers a reason for optimism, but confirmation would likely require a decisive move back above $69,000 on strong volume.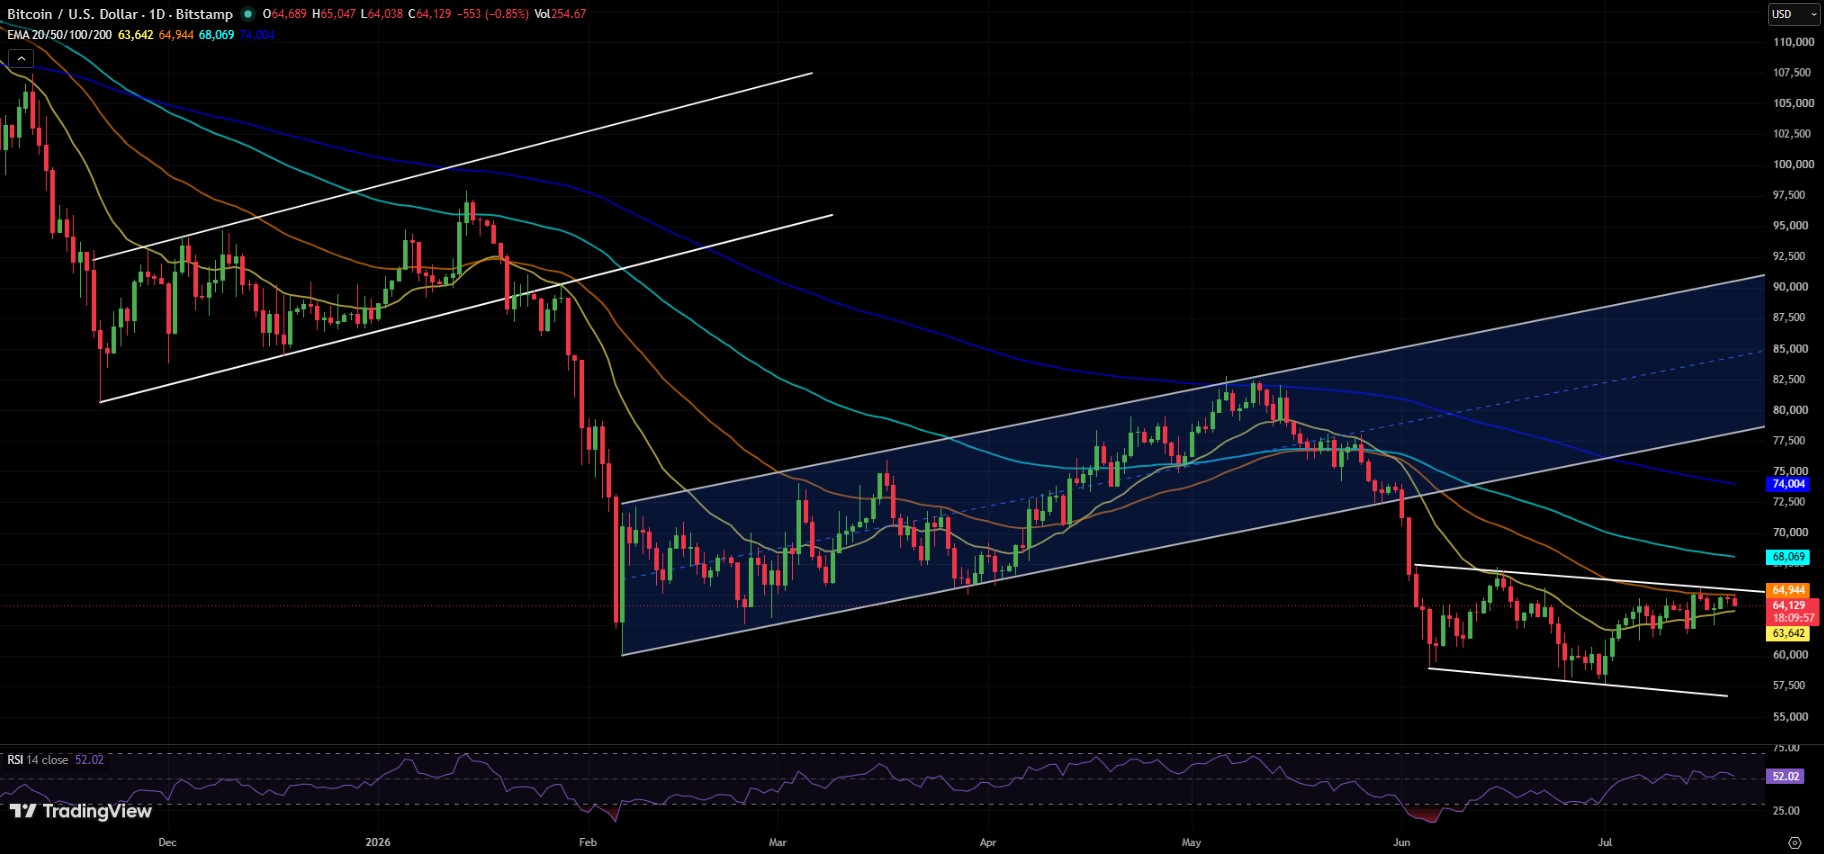
Disclaimer
This article is for informational purposes only and does not constitute financial, investment, or trading advice. Past performance and historical chart patterns do not guarantee future results. Always do your own research and consult a licensed financial advisor before making investment decisions.