Bitcoin Cash price prediction is drawing attention again after $BCH broke out of a pattern that had been squeezing the price tighter for days. The break already happened, but the price has co
Bitcoin Cash price prediction is drawing attention again after $BCH broke out of a pattern that had been squeezing the price tighter for days.
The break already happened, but the price has consolidated near right at that trigger level instead of extending higher, and that pause is exactly what traders are watching now.
Quick Take: $BCH is trading near $210.81. This is a short-term read based on the 1-hour chart.
A confirmed close above $213.56 strengthens the bullish outlook, while a close below $207.30 invalidates it. if the price closes decisively beyond either $213.56 or $207.30.
Bitcoin Cash Price Right Now
Metric
Value
Price
$210.81
24h Change
-0.26% (-$0.5497)
Market Cap
$4.22B
Futures Volume (24h)
$113.04M
Spot Volume (24h)
$14.08M
Open Interest
$298.21M
Circulating Supply
20.06M BCH
Total Supply
20.06M BCH
Max Supply
21.00M BCH
Price taken from the live TradingView chart, with volume, market cap, open interest, and supply figures from Bitcoin Cash data on CoinGlass, as of July 25, 2026, around 9:35 AM IST. For the full live breakdown, ourBitcoin Cash price prediction hub tracks these numbers continuously.
Methodology And Data Sources
This Bitcoin Cash price outlook uses the 1-hour BCH/USDT chart on Binance via TradingView for price structure, with volume, open interest, and market cap figures from CoinGlass and liquidation flow from CoinGlass's BCH liquidation tracker.
All levels are treated as invalidated only on a confirmed candle close beyond the stated trigger, not an intraday wick.
This is a short-term, intraday read and is not intended as a long-term Bitcoin Cash price forecast.
Why Is BCH Attempting A Breakout Today
$BCH had been compressing inside a falling wedge for several sessions, with price coiling tighter into support as the pattern narrowed.
That wedge already broke to the upside a short while back, and price is now sitting right on top of that breakout level rather than extending away from it.
RSI on the chart is showing a bullish divergence into this same zone, with price carving a lower low earlier while RSI itself failed to follow, curling higher instead.
That kind of setup often shows up right before buyers try to press an advantage, and it lines up with what the liquidation flow is showing in the most recent hours.
Bitcoin Cash Liquidation Data Today
Liquidation activity over the past day leans firmly toward shorts getting caught out in the shortest windows, even though the picture looks different further back. Over the past hour, $21.07 was liquidated, and all of it came from short positions, with zero long liquidations in that window.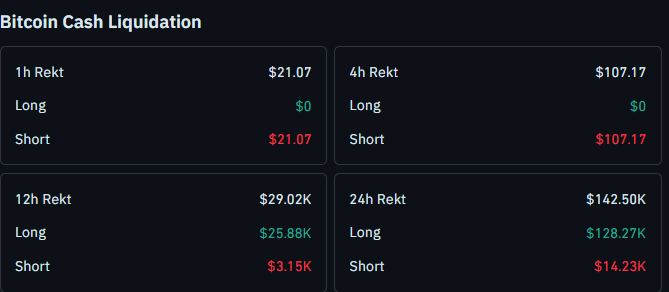
The 4-hour figure tells the same story, $107.17 in total liquidations, entirely from shorts.
The liquidation profile shifts on wider timeframes. Over 12 hours, the total reaches $29.02K, with $25.88K from longs and just $3.15K from shorts.
Across the full 24 hours, liquidations hit $142.50K, and longs account for $128.27K of that, while shorts make up the remaining $14.23K.
The heavy day-long skew toward long liquidation lines up with the earlier slide into support, while the short-lived flip in the 1-hour and 4-hour windows hints that late sellers are the ones getting squeezed as price holds the breakout.
A full breakdown is available through theBCH critical support test coverage on CoinGlass liquidation data.
Bitcoin Cash Price Outlook: 1-Hour Chart Analysis
On the 1-hour chart, $BCH spent the past several sessions carving out a falling wedge directly at a support shelf, with lower highs and lower lows converging into a tighter and tighter range.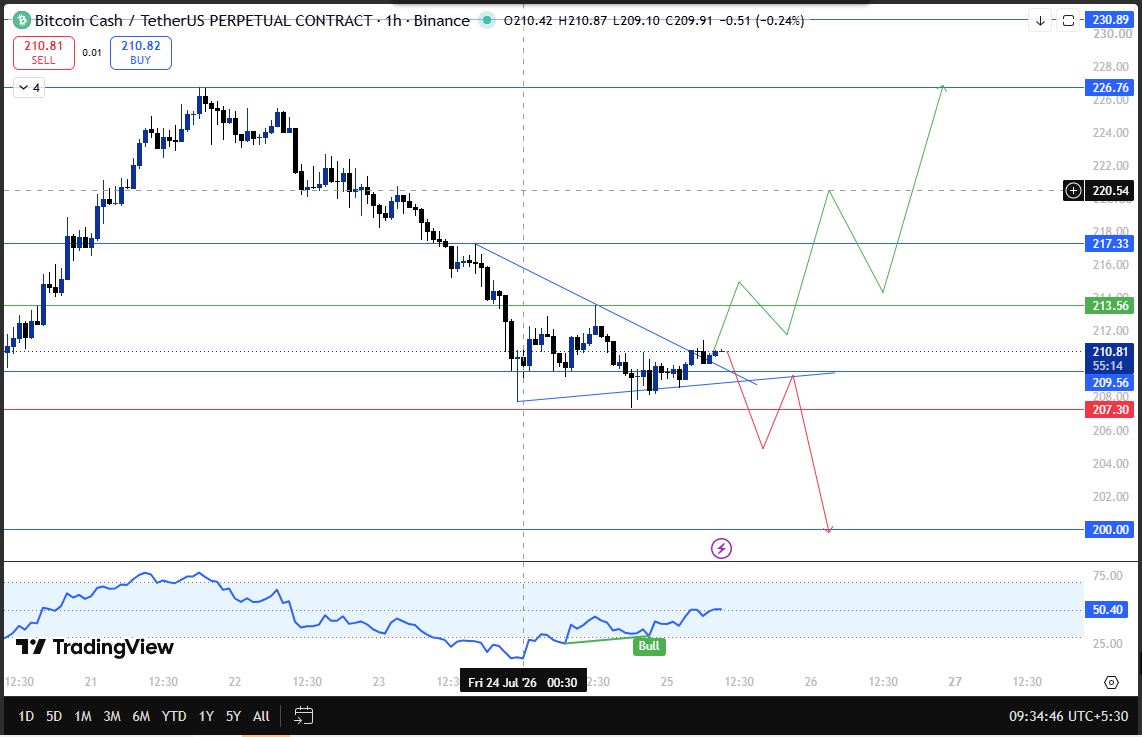
That kind of compression at support usually resolves with a decisive move, and here it resolved to the upside, with the price already breaking above the wedge trendline before settling back onto it.
The bigger question now is whether that breakout holds or fades back into the wedge.
A confirmed close above $213.56 would be the clearest sign buyers have taken control of the structure, opening the path toward $217.33, then $226.76 to $230.89 further out.
If price instead fails to build on this breakout, a confirmed close below $207.30 would flip the setup bearish, with the $200 psychological support next in view.
Bitcoin Cash Technical Snapshot
Indicator
Signal
Trend
Falling wedge broken to the upside, price holding at the breakout level
Structure
Buyers defended support through the wedge; follow-through not yet confirmed
Liquidations
Shorts dominate the 1h and 4h totals; longs still lead the 12h and 24h figures
RSI
Bullish divergence forming into the breakout zone
BTC Correlation
A wider market tone will likely decide whether the breakout extends
For context on how this kind of wedge setup has played out before, ourBitcoin Cash price prediction hub covers a comparable structure from earlier in the trend.
Bitcoin Cash Support And Resistance Levels To Watch
Type
Level
Note
Resistance 3
$226.76 to $230.89
Extended upside target
Resistance 2
$217.33
Next hurdle after $213.56
Resistance 1
$213.56
Confirmation trigger for breakout continuation
Current Price
$210.81
Sitting right at the breakout level
Support 1
$209.56
Immediate wedge support
Support 2
$207.30
Key closing-basis level, breakdown trigger
Support 3
$200.00
Psychological support for confirmed breakdown
Risk-Reward Table
Case
Trigger
Target
Bull Case
Closes above $213.56 on 1h timeframe
Move toward $217.33, then $226.76 to $230.89
Bear Case
Fails to hold and closes below $207.30
Slide toward $200.00
Invalidation Level
The bullish read on $BCH stays intact as long as the price holds above $209.56 on a closing basis.
A confirmed close below $207.30 shifts focus to the $200 psychological support, and losing that level would open more downside from there.
If the price instead closes back above $213.56, that is treated as confirmation the wedge breakout has real follow-through and buyers are maintaining control .
This mirrors the closing-basis logic used in ourBCH critical support test coverage, where a similar trigger determined the next move.
How Bitcoin Could Influence BCH
While this setup is based on $BCH's own 1-hour chart, $BTC remains the bigger swing factor for the wider altcoin market, and BCH is no exception. If Bitcoin holds steady or pushes higher, it improves the odds of BCH clearing $213.56 and working toward $217.33 and the $226.76 to $230.89 zone.
A Bitcoin pullback, on the other hand, raises the chances the wedge breakout fades and $BCH slips back toward $207.30 or $200.
Traders should also keep an eye on Bitcoin dominance, since a pullback there tends to help altcoins like BCH find fresh buying interest.
Bitcoin Cash Glossary
Falling Wedge: A chart pattern formed by two converging downward-sloping trendlines, often resolving with an upside breakout when it forms near support.Bullish Divergence: When price makes a lower low but a momentum indicator like RSI fails to confirm it, often signaling weakening downside pressure. RSI (Relative Strength Index): A momentum indicator used to judge whether an asset has moved too far too fast in one direction. Liquidation: What happens when a leveraged trade gets forcibly closed because the trader ran out of margin to keep it open.BTC Dominance: Bitcoin's share of the total crypto market cap, often used as a gauge of whether capital is favoring Bitcoin or altcoins.
CoinGabbar's Technical Analyst View
The falling wedge breakout is the more meaningful signal on this $BCH chart, since the pattern had been compressing price into support for several sessions before buyers finally pushed through.
That said, the breakout has not been confirmed with a decisive close yet, and price parking right on the trigger level means the next few candles matter.
A close above $213.56 would support a move toward $217.33 and possibly $226.76 to $230.89.
A slip back below $207.30 on a closing basis would suggest the breakout has failed, with $200 becoming the next level to watch.
Wider market direction, and whether Bitcoin dominance eases, will likely have as much say in BCH's next move as this chart structure does.
Disclaimer
This Bitcoin Cash price prediction is based on technical chart analysis and market data available at the time of writing. Cryptocurrency markets are highly volatile, and prices can change rapidly. This content is for informational purposes only and should not be considered financial advice. Always do your own research and consult a qualified financial advisor before making any investment decisions.