$BCH is trading around $245.60 right now, sitting just under a descending trendline that has capped nearly every rally attempt for months. Working out where this token goes next takes a prope
$BCH is trading around $245.60 right now, sitting just under a descending trendline that has capped nearly every rally attempt for months.
Working out where this token goes next takes a proper look at how this trendline has behaved so far before making any Bitcoin Cash price prediction calls.
Bitcoin Cash currently ranks 21st among all cryptocurrencies, holding a market cap close to $4.92 billion and a fully diluted value at the same level, out of a total supply of 20,059,891 tokens, all of which are already in circulation.
This Bitcoin Cash coin price prediction leans on that same trendline structure to work out what happens next.
Bitcoin Cash Price Right Now
Metric
Value
Current Price
$245.60
Market Cap
$4.92B
24H Volume
$116.5M
Circulating Supply
20,059,891 BCH
Total Supply
20,059,891 BCH
Bitcoin Cash Liquidation Data
Short positions have been taking the bigger hit recently, with $92.61K in short liquidations over the past 24 hours compared to $47.31K on the long side.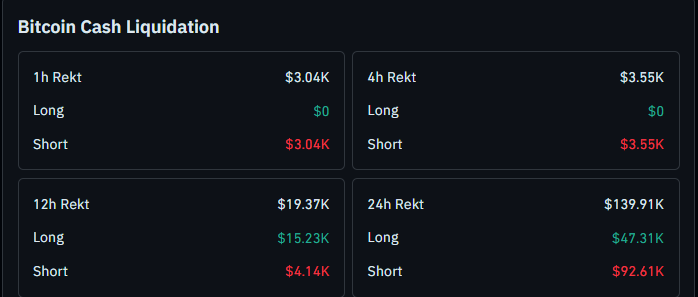
That kind of imbalance usually shows up right before a squeeze higher, since short sellers get forced to buy back in as price climbs.
Source: Liquidation data by CoinGlass
Bitcoin Cash Chart Structure Right Now
On the daily chart, BCH has been trading under a steep descending trendline that started forming back in February this year, right after the price topped out near the $650 zone.
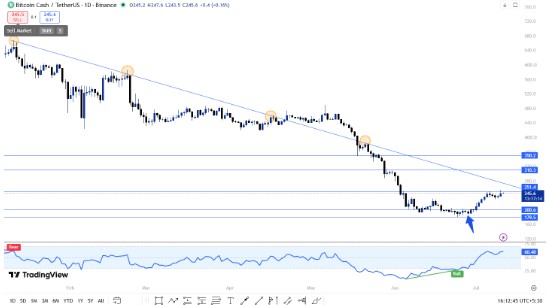
Since then, price has respected this trendline closely, sliding lower every time it pushed up into it.
There was one attempt to break through it, and price actually pushed above the line briefly, but sellers stepped back in fast and dragged BCH right back down under it.
That rejection sent price down toward the $180 to $200 area, where buyers finally showed up and started defending the zone.
Since then, BCH has bounced off that support and is now grinding its way back up toward the same trendline.
This is actually the fourth time price has come up to test this exact line, and each retest tends to weaken a trendline a bit more.
The daily RSI is around 60.48, and it's been climbing steadily, which lines up with the recent bounce off support.
Anyone tracking crypto price predictions this cycle knows repeated retests like this usually end with a breakout rather than another endless rejection.
What This Setup Means Going Forward
With the trendline being tested for a fourth time now, the odds of a real breakout are building.
Markets rarely respect the same line forever, and four touches is usually where structures start to crack.
If BCH clears this trendline with a proper close above it, the first real target sits in the $300 to $350 zone, an area that lines up with the $310.3 and $350.2 levels marked on the chart.
On the other hand, if this breakout attempt fails again like the last one did, the price would likely head back down to retest the $200 and $180 support zones before trying another push higher.
Support and Resistance Levels
The $200.6 level and the $179.5 zone below it are the key supports to watch, since both have already caught the recent drop and held.
On the upside, the descending trendline itself is the first hurdle, with $251.4 as immediate resistance, followed by $310.3 and then $350.2 once the trendline clears.
Risk and Reward: The Honest Version
Factor
Bull Case
Bear Case
Support Zone ($180 to $200)
Holds, fuels a fresh push back to the trendline
Breaks down, structure weakens
Descending Trendline
A fourth test finally breaks, opens $300 to $350
Rejects again like the last attempt; price stays capped
The analysis above combines historical price structure with publicly available market data and should not be treated as a guarantee of future performance.
Invalidation Level
This entire setup depends on the $180 support zone staying intact.
A close below roughly $179.5 would invalidate the bullish structure, and in that case BCH would likely need to build a new base lower down before any fresh attempt at the trendline becomes realistic.
Expert View
Sentiment around BCH has stayed fairly steady, with several analysts pointing to its role as one of the original Bitcoin forks and its continued presence on major crypto exchanges as reasons for long-term relevance.
The current retest of the descending trendline is being watched closely, since a fourth touch has historically been the point where structures either break or hold for good.
Most agree the coming days near this trendline will be the real test of whether BCH is ready for a move toward $350. Traders keeping an eye on thefear and greed index may find it useful for gauging sentiment shifts around this kind of setup.
Conclusion
BCH's chart really comes down to one structure right now, the descending trendline that has capped every rally since February, tested four times over.
If the $180 support zone holds and the trendline finally breaks, the path opens toward $300 to $350. If it fails again, the price likely dips back to retest support first. Keeping an eye on crypto price predictions across other major coins can also help put this setup into broader market context.
Disclaimer: This article is for informational purposes only and should not be considered financial advice. Cryptocurrency markets are highly volatile, and price predictions are not guaranteed. Please do your own research before making any investment decisions.