Is a 7.4% daily jump enough to change the trend, or will sellers take it back? The Bitcoin Cash price prediction November 2026 starts at $301.30, as per CoinGecko, as the price nears a resist
Is a 7.4% daily jump enough to change the trend, or will sellers take it back?
The Bitcoin Cash price prediction November 2026 starts at $301.30, as per CoinGecko, as the price nears a resistance zone and sellers defended before. Compare it with theprevious BCH forecast.
Bitcoin Cash 24-Hour Market Snapshot
The Bitcoin Cash price prediction November 2026 rests onCoinGecko market data plus four more data blocks.
Fully diluted valuation (FDV) prices the whole supply at today's rate. $BCH market cap and FDV both read $6.046B because circulating and total supply match at 20.109M.
Metric
Value
Price
$301.30
24h change
+7.4%
Market cap
$6.046B
FDV
$6.046B
24h trading volume
$249.948M
Perps 24h open interest
$1.094B
Circulating supply
20.109M BCH
Max supply
21M BCH
Source: CoinGecko market data, Oct 28, 2026, 10:30 UTC.
BCH Holder Concentration: Who Owns the Tracked Supply?
PerBscScan token holder data, the top 5 wallets hold 66.76% of tracked value.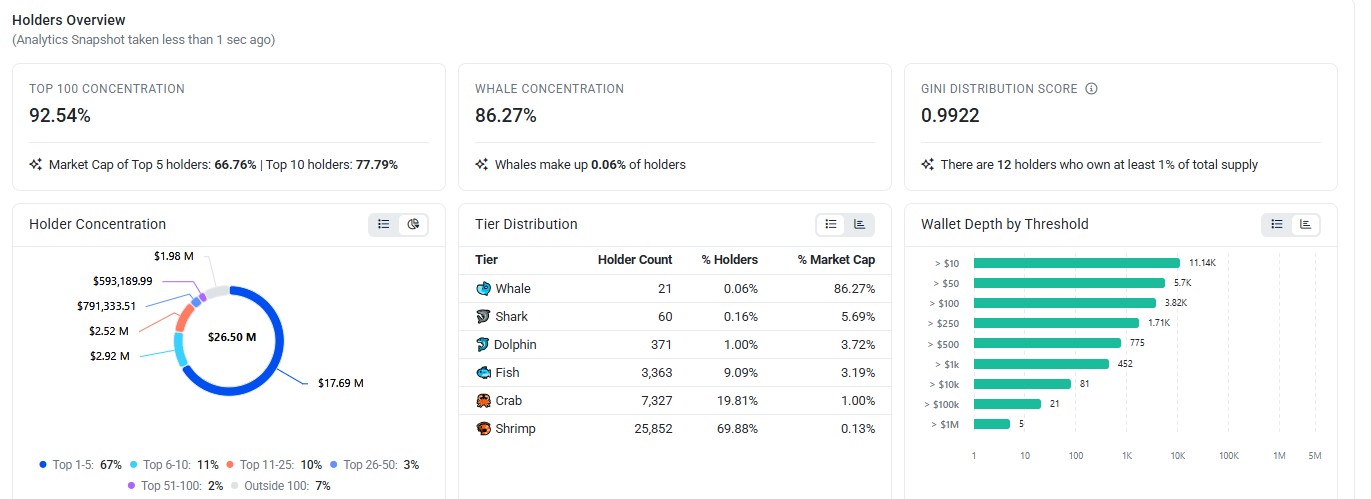
Source: BscScan token holder analytics, captured Oct 28, 2026, 10:30 UTC.
$BCH holder concentration is extreme in the tracked data, with the top 100 wallets at 92.54%.
But the concentration totals only $26.50M. That equals 0.44% of the $6.046B market cap, so wallet moves here have limited pull on BCH price.
BCH Whale Wallets Own 86.27% of Tracked Value
Awhale wallet is a very large holder. In the same data, 21 $BCH whale wallets make up 0.06% of holders.
They own 86.27% of tracked value. And whale selling on this token can drop its price fast, while holding keeps supply tight.
BCH Liquidation Data Shows Shorts Took the Hit
Shorts got squeezed. CoinGlass $BCH liquidation data as of Oct 28, 2026, 10:30 UTC, shows $784.16K wiped out in 24h.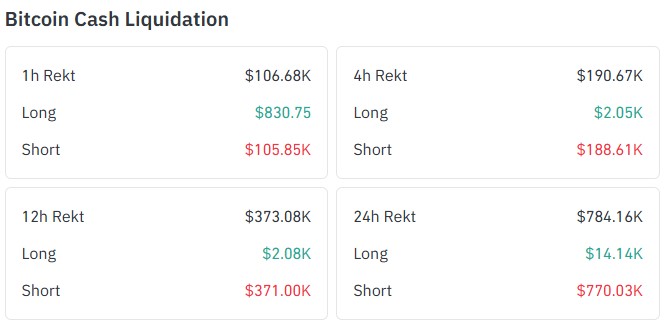
Source: CoinGlass, captured Oct 28, 2026, 10:30 UTC.
Shorts took $770.03K of the total, against $14.14K for longs.
That puts shorts at 98.20% of the 24h losses. Forced short exits are buy orders, so they lift price until the fuel runs out.
A liquidation is a forced exit when a margin trade runs out of cushion, andhow liquidation works explains the steps.
BCH Open Interest and Futures Volume: Binance Leads
Open interest counts the futures contracts still open, and CoinGecko data puts $BCH open interest at $1.094B.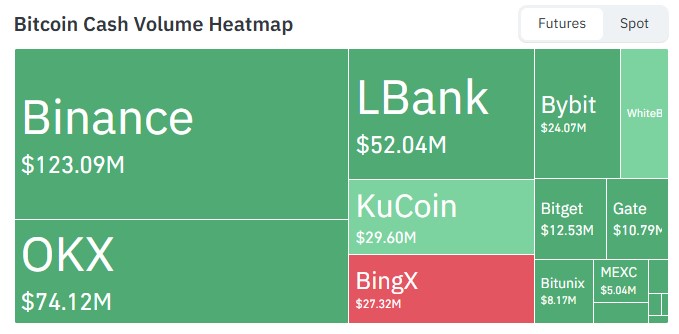
Source: CoinGlass, captured Oct 28, 2026, 10:30 UTC.
OnCoinGlass futures volume as of Oct 28, 2026, 10:30 UTC, $BCH futures volume puts Binance first at $123.09M. OKX follows at $74.12M.
That's a $48.97M gap between the top 2.
At $1.094B, open interest can amplify a move in either direction once positions unwind.
BCH Technical Analysis: From Falling Channel to Breakout Test
The chart tells a simple story in the Bitcoin Cash price prediction November 2026 setup. Price sat under the $266.65 level on Sep 17 to 21.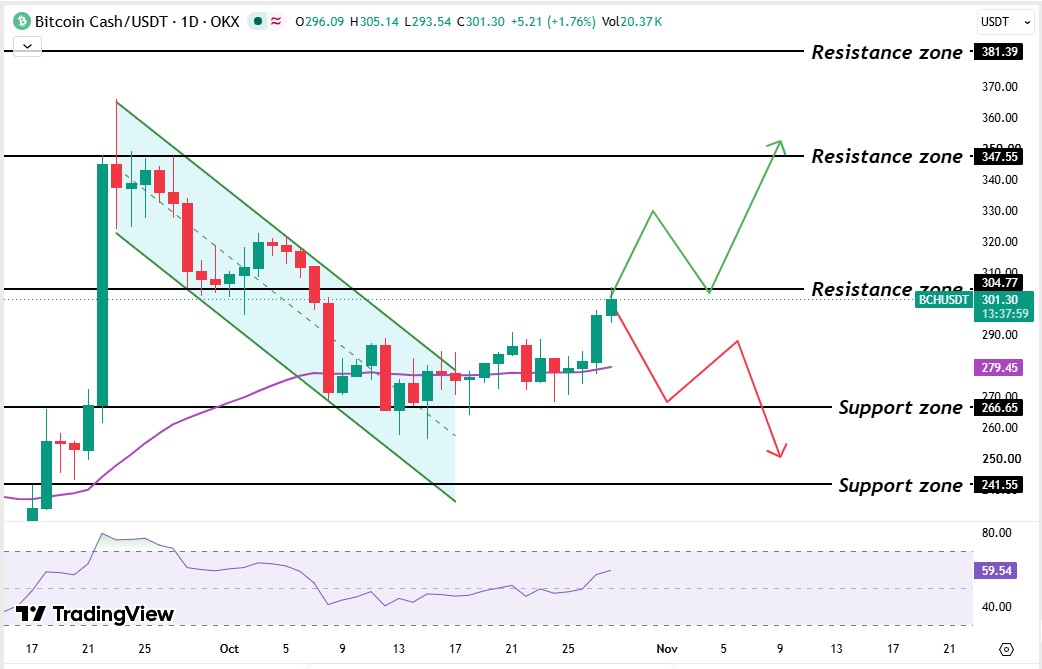
Source: TradingView, BCH/USDT 1D on OKX, captured about 10:22 UTC on Oct 28, 2026.
A single green candle on Sep 22 drove the price from $266.65 toward the $347.55 level. And the next day the candle spiked above the $347.55, made a wick, and closed under the $347.55 level.
After that price turned bearish and started making the lower highs and lower lows, then formed a falling channel.
Sellers tested the $266.65 level in mid-October, and buyers defended it each time. The price broke above the upper channel line around Oct 17.
But the price stalled in a tight band around the EMA for a week. The last 3 daily candles are green, and the latest test is $304.77.
$BCH 50-day EMA sits at $279.45. Price chopped around it from Oct 18 to Oct 25, right now EMA acting as strong support.
$BCH RSI reads 59.54. Above 50 favors buyers, and 70 marks an overbought condition.
BCH Support Levels and Resistance Levels
Level
Type
$381.39
Resistance
$347.55
Resistance
$304.77
Resistance
$279.45
50-day EMA support
$266.65
Support
$241.55
Support
The nearest $BCH resistance levels are $304.77 and $347.55. $BCH support levels start at $279.45.
Bitcoin Cash Forecast: Bull, Base, and Bear Scenarios
Scenario
Trigger
Target
Invalidation
Bull
Daily candle trades above $304.77
$347.55
Trades below $279.45
Base
Holds $279.45 to $304.77
Range
Break of either level
Bear
Trades below $279.45
$266.65
Trades above $304.77
Buyers need strong volume to break the $304.77 level.
A fast unwind of $1.094B in open interest can speed any drop, and a daily candle trading below the EMA voids the bull case.
Bitcoin Cash price prediction November 2026 : Expert Outlook
As per CoinGabbar analysis, the Bitcoin Cash price prediction November 2026 is bullish above the $279.45 EMA level. RSI reads 59.54 and also favors the buyers.
The level to watch is $279.45. A daily candle trading below it ends the bull case and exposes $266.65.
Disclaimer: This article is for information only and isn't financial advice. Crypto assets are highly volatile, and prices can move sharply in either direction. Readers should do independent research and consider their own risk tolerance before making any decision.
