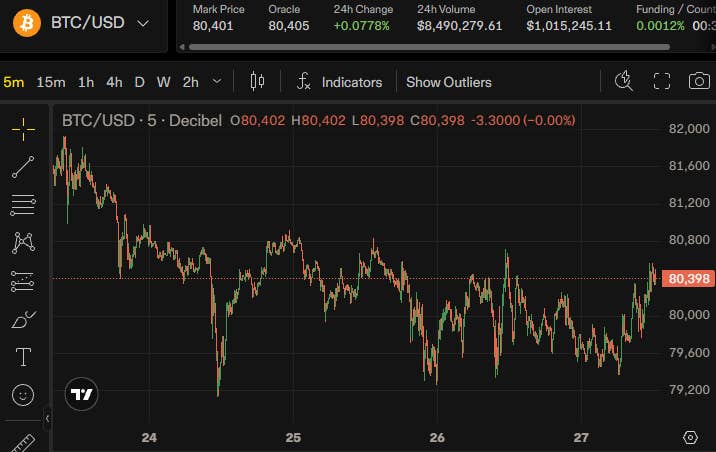
Bitcoin has been pretty quiet over the past few days, and I know that kind of market can feel frustrating. But there are still a few levels I’m watching closely. On the daily chart, we’ve los
Bitcoin has been pretty quiet over the past few days, and I know that kind of market can feel frustrating. But there are still a few levels I’m watching closely. On the daily chart, we’ve lost the 50-day EMA. On the weekly chart, though, we’re still holding the 50-week EMA. That’s an important difference, and it’s why I haven’t changed my overall bullish view. I do think we could see another dip first.
BTCUSDT chart by TradingView
Daily chart: I wouldn’t rule out a move toward $75K
Looking at the daily chart, Bitcoin is trading around $80,000 and has slipped below the 50-day EMA. For me, that opens the door to another move down toward $77,000. We could even see a quick sweep into the $75,000 area, or briefly below it, to take liquidity before a rebound. I’m not saying that has to happen. It’s simply a scenario I’m prepared for, and I wouldn’t call it a new bear market just because price briefly dips below support.
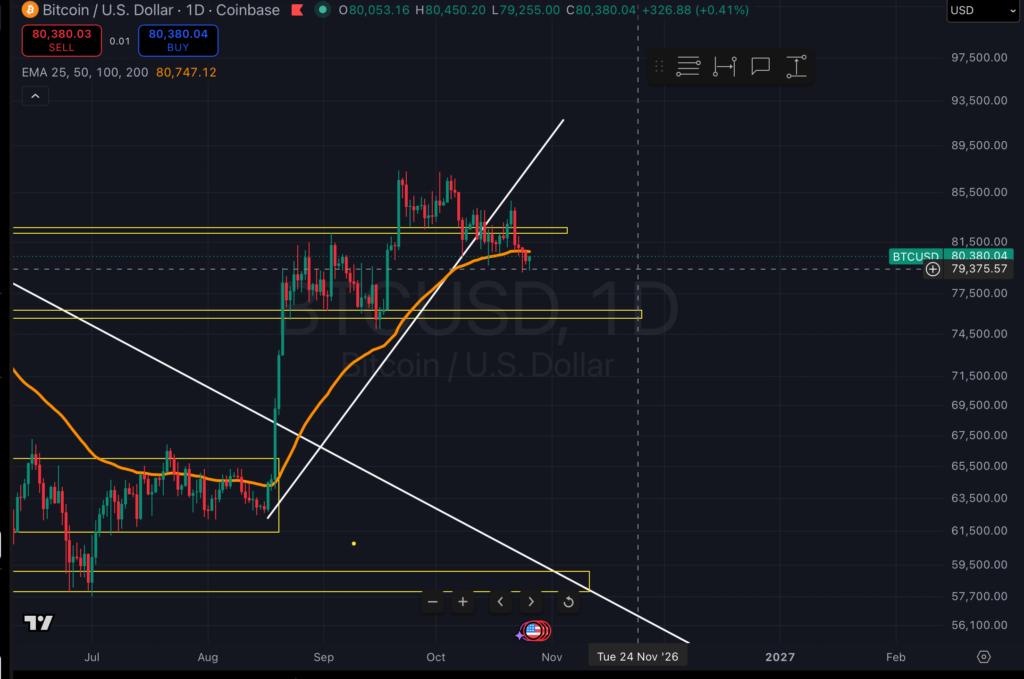 BTC/USD daily chart — TradingView
Weekly chart: this is what matters most to me
Now zoom out to the weekly chart and the picture looks different. Bitcoin hasn’t lost the 50-week EMA. That’s the level I’m paying the most attention to right now. As long as we don’t get a weekly candle closing below it, I still seeroom for the bullish scenario to play out. If we do close below that EMA, I’ll need to reassess the setup rather than pretend nothing has changed.
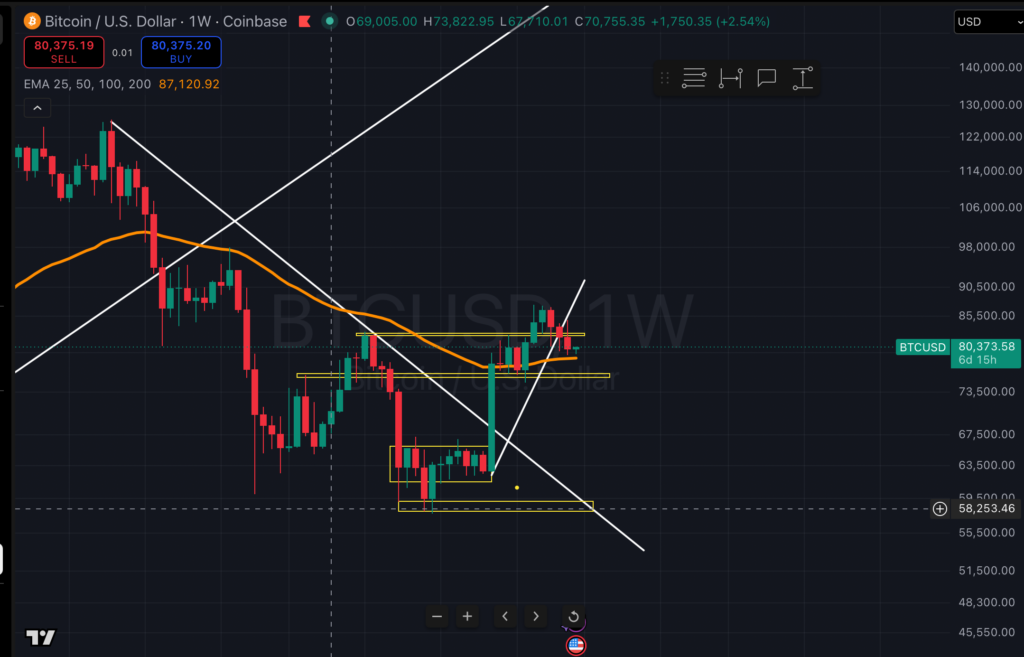 BTC/USD weekly chart — TradingView,
ETF flows are mixed, and the market is waiting on the Fed
Another reason the market feels so slow is that we’re not seeing steady buying or selling through the US spot Bitcoin ETFs. The flows have been going both ways. In the figures I’m sharing, 21 October brought $524.8 million in net inflows, but 22 October saw $635.6 million in outflows, followed by another $137.9 million leaving on 23 October. To me, that doesn’t show a market with strong conviction in either direction right now.
And there’s another date on the calendar: 28 October, when the Federal Reserve is due to announce its rate decision. I think a lot of traders are waiting to see what happens before taking bigger positions. We could get more volatility around that decision, but I won’t try to guess the reaction before the market shows its hand.
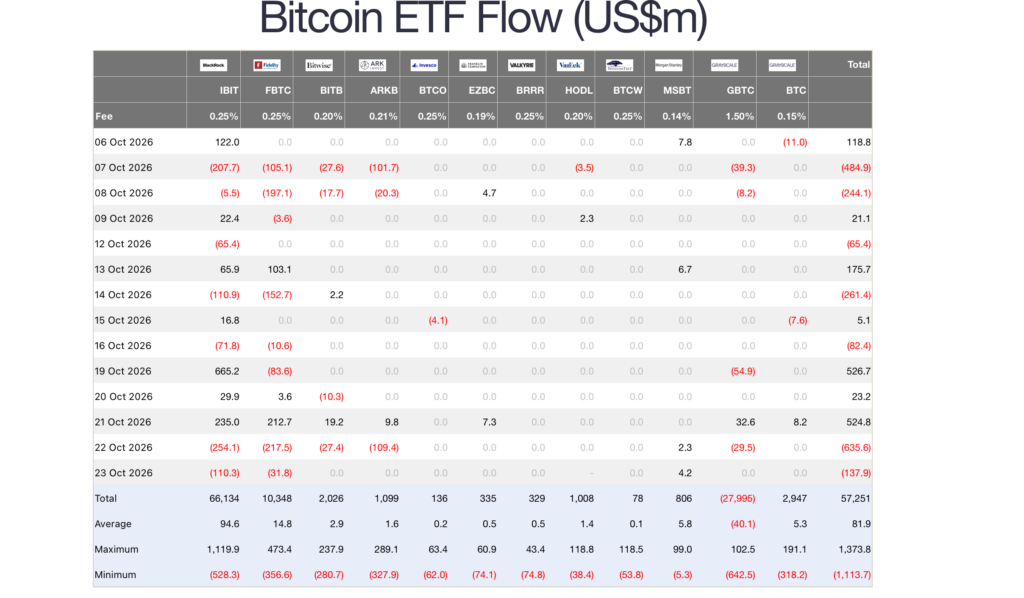 US spot Bitcoin ETF net flows (US$ millions), through 23 October 2026.
What I’m looking for in November: $90K–$92K
Here’s how I see the next few weeks. First, I wouldn’t be surprised by one more dip toward $77,000 or even a liquidity sweep around $75,000. After that, if Bitcoin finds buyers and manages to break through the $85,000–$87,000 resistance area, my next target is $90,000–$92,000 over the following month. I want to see a real break and buyers stepping in, not just a quick wick above resistance that gets sold straight back down.
Conclusion
So yes, Bitcoin has been boring lately. But I don’t think that means the bigger opportunity has disappeared. We’ve lost the 50-day EMA, not the 50-week EMA, and that’s why I’m still leaning bullish overall. I’m watching for a possible final sweep lower, the weekly close relative to the 50-week EMA, and then a convincing break of $85,000–$87,000. If those pieces fall into place, $90,000–$92,000 remains my target for November. If the weekly structure breaks, I’ll change my view accordingly.