Bitcoin Dominance Drops Below 60% After $87K Rejection: What's Next? Bitcoin price is holding near $84,000 after getting rejected twice at the $87,000 level this month. At the same time, Bitc
Bitcoin Dominance Drops Below 60% After $87K Rejection: What's Next?
Bitcoin price is holding near $84,000 after getting rejected twice at the $87,000 level this month. At the same time, Bitcoin dominance has slipped below the 60% mark for the first time in weeks.
This drop in dominance is catching the eye of traders. It often hints that money is starting to move into altcoins.
But this cycle looks different from past ones, and the numbers tell an interesting story.
What Is Bitcoin Price Doing Right Now?
Bitcoin climbed from around $75,000 to $87,000 in a matter of weeks, a jump of about 16.5%.
After that run, the price cooled off. It fell almost 4% from the top and found support near $80,000.
From there, bulls pushed BTC back up, and it briefly touched $87,300. But sellers stepped in again.
The coin then dipped below $83,000 on Thursday before bouncing back. As of today, September 26, Bitcoin is trading around $84,000.
Why Is Bitcoin Dominance Falling Below 60%?
Bitcoin dominance measures how much of the total crypto market belongs to Bitcoin alone.
That number has slipped to 58.5% as of September 26. It failed to hold above the 60% level, which many traders watch closely.
When Bitcoin dominance drops, it usually means altcoins are gaining ground. The altcoin market cap, not counting Bitcoin, has grown to about $1.17 to $1.19 trillion. That is a 33% jump since mid-August.
Is This the Start of Altcoin Season?
Not quite yet, based on the data.
Glassnode's Altcoin Cycle Signal, which checks on-chain conditions for altcoin strength, hit 81.25 on September 22. That is a high reading.
But the Altcoin Season Index, which tracks actual price performance against Bitcoin, tells a calmer story. It has stayed between 45 and 53. A true altcoin season needs a reading above 75.
So the setup looks ready on paper, but altcoins have not fully taken off yet.
Indicator
Current Reading
What It Signals
BTC Dominance
58.5% - 59.1%
Falling below 60% support
Glassnode Altcoin Cycle Signal
81.25
Conditions favor altcoins
Altcoin Season Index
45 - 53
Still neutral, no altseason yet
Altcoin Market Cap (ex-BTC)
$1.17T - $1.19T
Up 33% since mid-August
Total Crypto Market Cap
$3 trillion+
Reclaimed after BTC's run
BTC ETF Net Inflows (7 sessions)
$2.978 billion
Steady buying despite dominance drop
How Is This Cycle Different From 2017 and 2021?
In 2017 and 2021, falling Bitcoin dominance was often the starting gun for big altcoin rallies. Dominance dropped from above 60-70% all the way into the 40-50% range as money rushed into smaller coins.
This time, Bitcoin ETFs are changing the flow of money. These funds pull institutional cash straight into Bitcoin itself.
The people buying Bitcoin through an ETF are usually not the same crowd buying small-cap altcoins on decentralized exchanges. That means less spillover into altcoins than in past cycles.
Why Are BTC ETFs Still Buying While Dominance Drops?
Here is where things get a bit confusing for traders.
Bitcoin ETFs have shown a net inflow of $2.978 billion over the last seven sessions. That is a large amount of steady buying.
Yet dominance is still falling. This mismatch suggests some capital is splitting off into altcoins even while institutional demand for Bitcoin itself stays strong.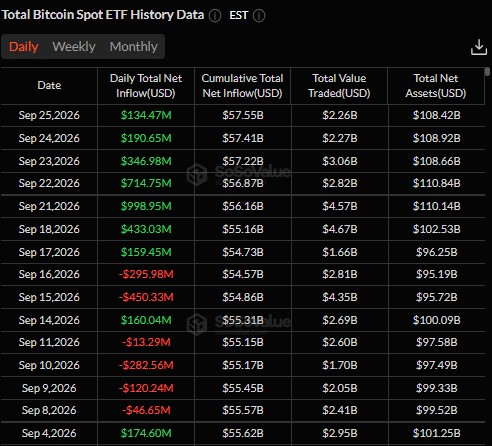
Bitcoin Dominance Chart: Key Levels to Watch
Bitcoin dominance is trading around 59.10% after breaking below the rising channel that had been guiding price higher since July.
The breakdown invalidates the channel structure for now, with BTC dominance falling back from the 60.20%–60.30% area and losing the channel’s lower trendline around 59.00%.
With the breakout support now lost, the next downside area to watch is around 58.50%–58.80%. A sustained move below this zone could signal further weakness in BTC dominance.
On the upside, 59.40%–59.50% now becomes an important area to reclaim. If dominance manages to recover above this zone, it could open the way back toward 60.50%–60.70%.
The RSI is around 45.8, showing neutral momentum but with a slight bearish tilt following the channel breakdown.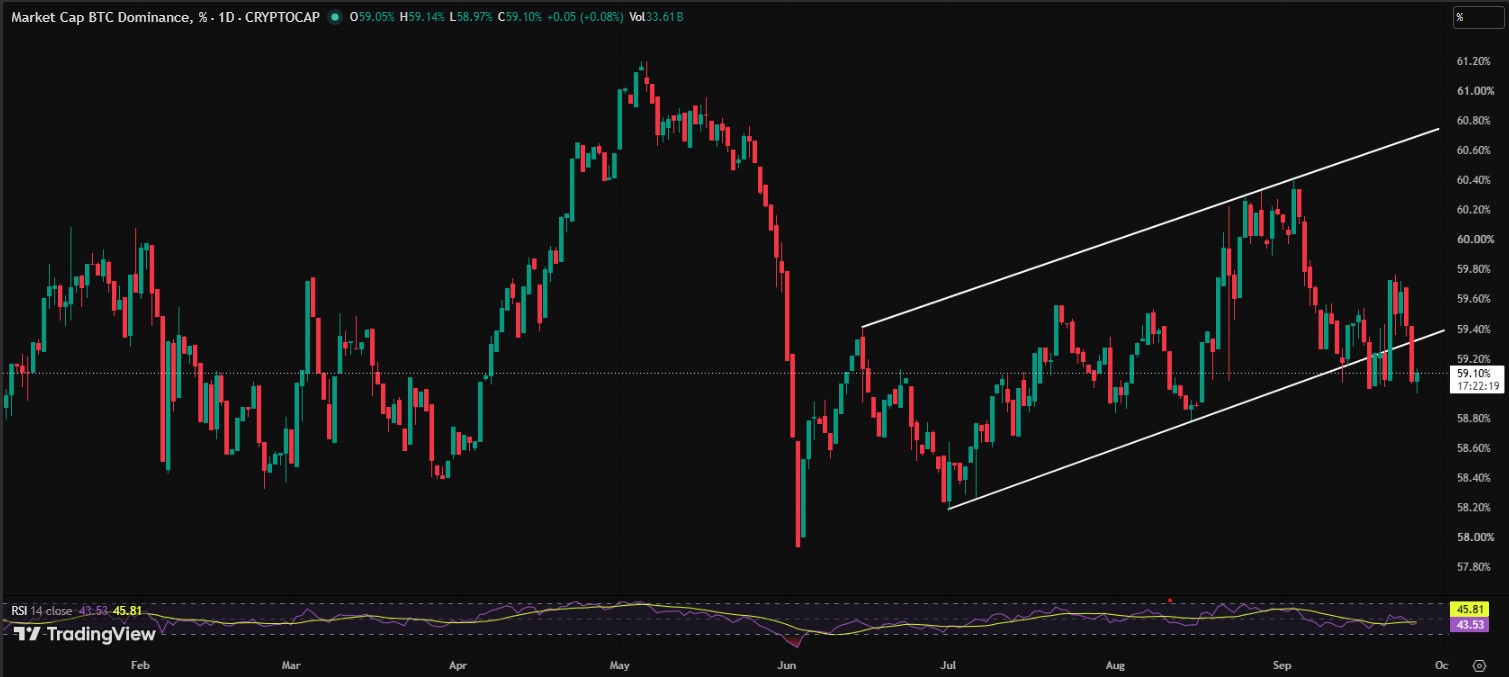
Bitcoin Price Prediction: What Could Happen Next?
For now, $84,000 looks like the middle ground for Bitcoin price after its pullback from $87,300.
The $80,000 zone has acted as solid support during this correction. As long as that holds, the broader uptrend from $75,000 stays intact.
If Bitcoin dominance keeps sliding toward the mid-50s, it would strengthen the case for altcoins gaining more ground. But if BTC ETF inflows keep piling in, Bitcoin could reclaim the 60% dominance level and pull attention back toward itself.
The 33% jump in altcoin market cap is worth noting, but many altcoins remain far below their old highs. This looks more like a recovery than full-blown euphoria.
Nobody can say for certain which way this goes. The setup is open, and both dominance and price action deserve close watching over the coming weeks.
Disclaimer
This article is for informational purposes only and should not be considered financial advice. Cryptocurrency markets are highly volatile and carry significant risk. Prices mentioned may change rapidly. Always do your own research and consult a licensed financial advisor before making any investment decisions.