Key Takeaways: BTC dropped to $72,960, down 0.67% on the day and 5% for the week Price broke below the 100 SMA at $73,225, which held for four consecutive days RSI at 34.49, pressing toward o
Key Takeaways:
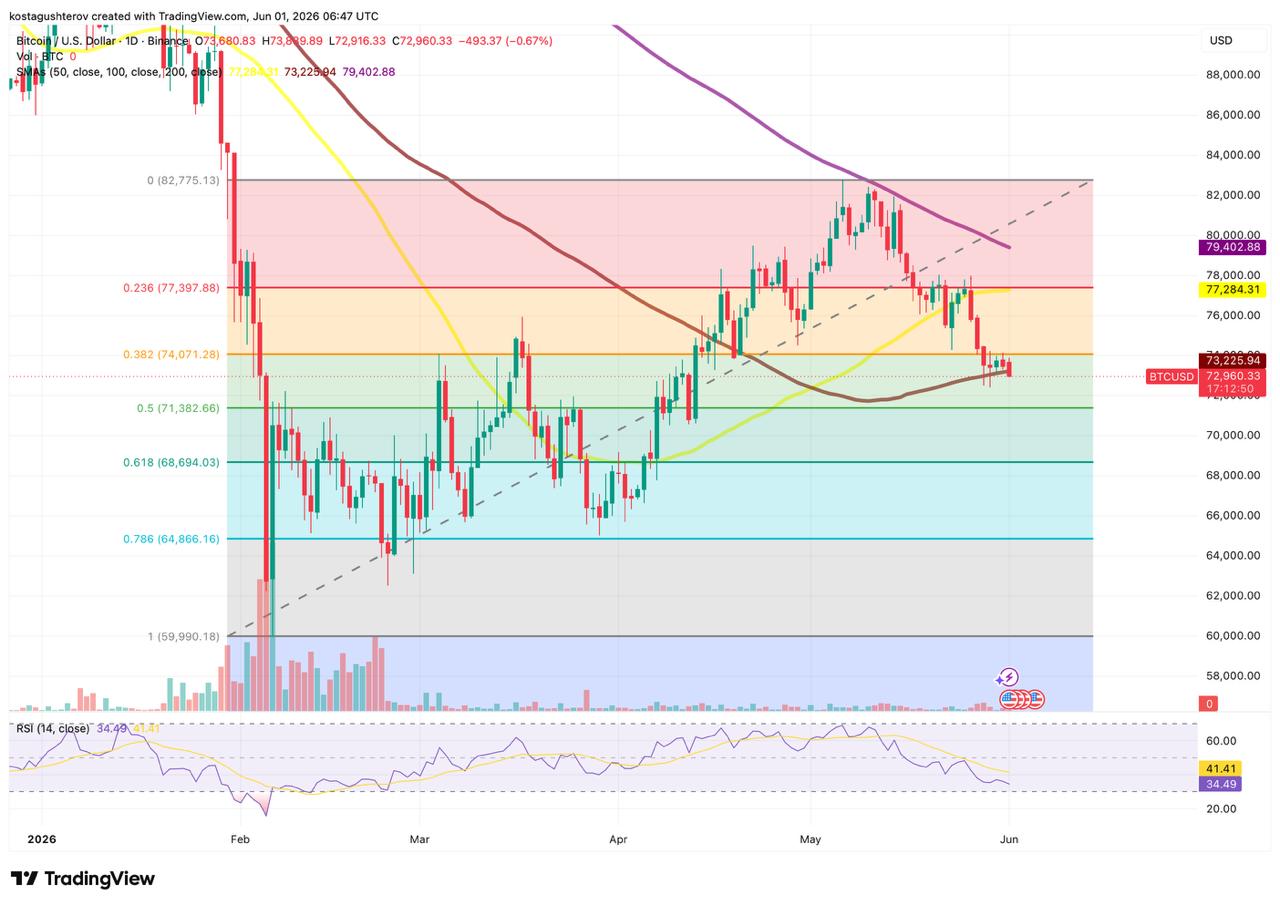
- BTC dropped to $72,960, down 0.67% on the day and 5% for the week
- Price broke below the 100 SMA at $73,225, which held for four consecutive days
- RSI at 34.49, pressing toward oversold levels last seen during the February crash
- US and Iran exchanged military strikes over the weekend near the Strait of Hormuz
- 0.5 Fib at $71,382 is the next floor if the 100 SMA cannot be reclaimed
Bitcoin is trading at $72,960, below the 100 SMA at $73,225. Looking at the past week, price dipped beneath this level on several occasions but recovered above it each time, with buyers stepping in before any daily candle could close below it. That pattern held until now. This morning price slipped through again, but unlike the previous dips, it has since extended lower rather than bouncing back, now sitting nearly $300 beneath the level that kept catching it.
That repeated recovery made the 100 SMA look like a reliable floor. The fact that it is now failing to produce the same bounce raises the question of whether this break is different. A daily close below $73,225 would be the confirmation. Previous sessions showed intraday breaks that did not stick. If today closes beneath it, the 100 SMA could shift from a level that kept saving price to one that now caps any recovery attempt.
RSI at 34.49 on the main line and 41.41 on the signal line is pushing into territory that has not been visited since the February crash. At those levels, selling momentum tends to exhaust itself. The last time RSI pressed this low it marked the beginning of the recovery that carried Bitcoin toward the May highs. That does not guarantee a repeat, but it does suggest the downside move may be running thin on fuel. A bounce from oversold RSI conditions without a macro catalyst could be enough to keep price above the 100 SMA on a closing basis, which is the minimum needed to keep the structure from deteriorating further.
Why This Drop Happened Today
The immediate trigger appears to be a fresh military escalation between the US and Iran that developed over the weekend. According to BBC, US Central Command confirmed it carried out what it called self-defence strikes against Iranian military sites, after a US drone was shot down over international waters. Iran’s Revolutionary Guard responded by targeting an air base used by US forces in the region.
This marks the third known military exchange between the two sides in a single week, all centered around the Strait of Hormuz, one of the world’s most critical oil shipping corridors. Separately, negotiations toward a broader deal collapsed over the weekend, with reports indicating President Trump requested changes to the terms before any agreement could move forward.
Markets tend to price geopolitical risk fast and sometimes overreact. The drop below $73,000 this morning looks consistent with risk-off positioning rather than a fundamental shift in crypto sentiment. That distinction matters for how the next few sessions might unfold, particularly if the diplomatic picture changes.
If the Macro Keeps Pressing
If tensions continue without any diplomatic progress, the 100 SMA may struggle to recover its role as support. A daily close below $73,225 could open the path toward the 0.5 Fibonacci at $71,382, the same level Bitcoin touched on April 13th before recovering. That zone sits close enough that it could come into play within days if selling pressure continues.
Below $71,382 the next visible reference on the chart is the 0.618 Fibonacci at $68,694, though reaching that level would require a significant further deterioration in both market sentiment and the geopolitical backdrop.
If the Geopolitical Picture Shifts
Reports over the weekend suggested both sides may be closer to an agreement than the latest military exchanges imply. If something concrete emerges, whether a ceasefire or a resumed negotiation framework, the relief could be enough to push Bitcoin back above the 100 SMA and give buyers room to build from there.
In that scenario, the first target that might come into play is the 0.382 Fibonacci at $74,071. A more definitive resolution, an actual signed agreement rather than just a pause in hostilities, could extend the move toward the 0.236 Fibonacci at $77,397 and the 50 SMA at $77,284, two levels sitting close enough together to act as a combined resistance zone.
For now, Bitcoin is sitting below a level it defended for four days, with RSI approaching oversold and a geopolitical situation that could shift the price in either direction before the daily candle closes.
The post Bitcoin Dropped Below $73,000 as US-Iran Tensions Escalated appeared first on Coindoo.