Key Takeaways On-Chain Footprint: Binance retail inflow (30D Sum) registered $9.197B on June 1, 2026, the highest single reading since November 20, 2025. Historical Parallel: The 6m–12m holde
Key Takeaways- On-Chain Footprint: Binance retail inflow (30D Sum) registered $9.197B on June 1, 2026, the highest single reading since November 20, 2025.
- Historical Parallel: The 6m–12m holder cohort, which accumulated near the mid-2025 peak above $100K, validates the same distribution pattern that preceded Bitcoin’s January 2026 correction to $65K.
- Macro Overlap: The inflow spike arrives as BTC trades at $68,900, already beneath the $70K level where previous sell-offs triggered automated derivative cascading.
Forensic Breakdown: What the June 1 Binance Inflow Actually Shows
CryptoQuant’s Binance Retail-to-Exchange Flow chart confirms a 30-day retail inflow sum of $9.197B registered at 05:00 UTC on June 1, 2026, the sharpest single reading since November 20, 2025, when Bitcoin was trading above $90K on its approach to cycle highs.
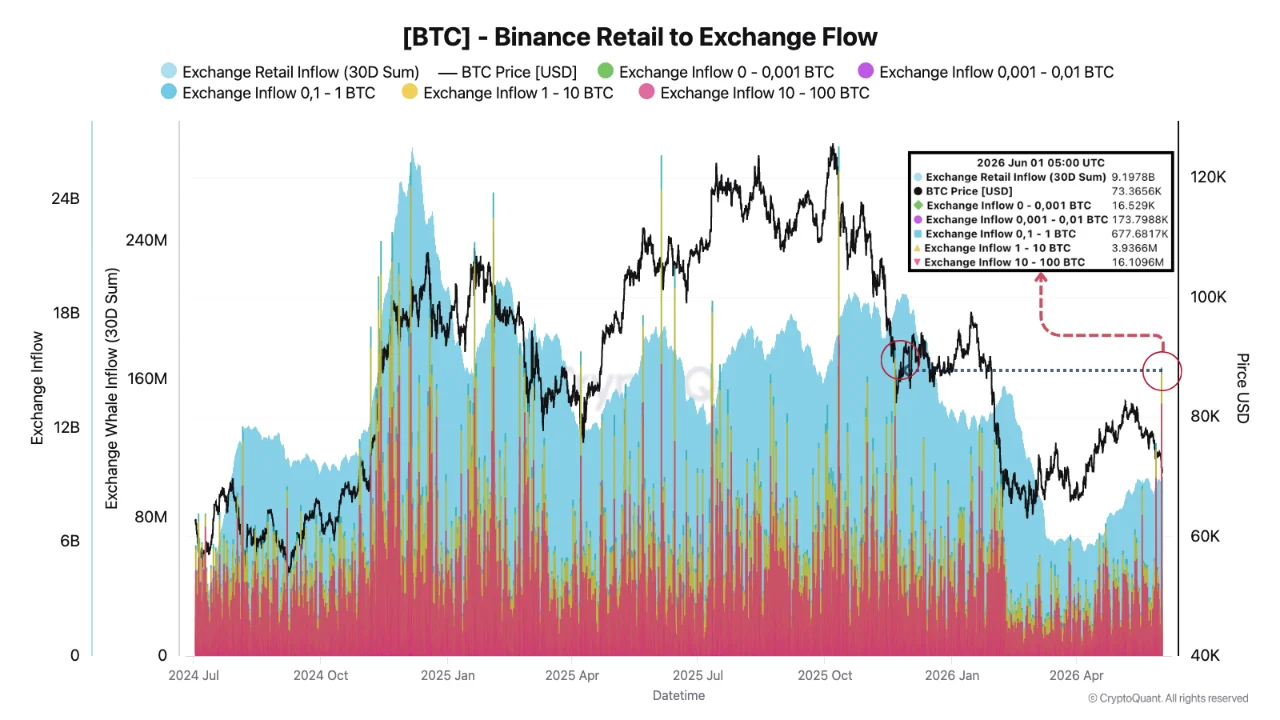
The inflow breaks down across five wallet brackets. The sub-0.001 BTC tier registered $16.529K, the 0.001–0.01 BTC bracket contributed $173.798K, and the 0.1–1 BTC cohort added $677.681K. The 1–10 BTC group moved $3.936M, while the 10–100 BTC bracket registered $16.109M. That final figure carries structural weight: a spike with this composition is not driven by small holders reacting emotionally, but by coordinated repositioning across multiple wallet tiers simultaneously, a pattern that historically correlates with sustained rather than transient exchange pressure.
Exchange inflows are not automatically bearish. Coins moving to exchanges can reflect selling intent, hedging, margin deployment, or rebalancing. Context determines the directional weight. With BTC trading for $68,900 at the time of writing according to CoinMarketCap data, already below the $70K level where historical liquidation data shows derivative cascading has previously amplified downside moves, the probabilistic weight of this inflow shifts toward defensive repositioning rather than opportunistic deployment.
The 6m–12m Cohort: Distribution From the Cycle Peak
CryptoQuant’s Exchange Inflow Spent Output Age Bands chart for All Exchanges shows the 6m–12m holding cohort generating its heaviest inflow columns of the current recovery cycle through May and into early June 2026. These coins were accumulated between approximately June and December 2025, the period spanning Bitcoin’s mid-cycle peak above $100K and its subsequent distribution phase.
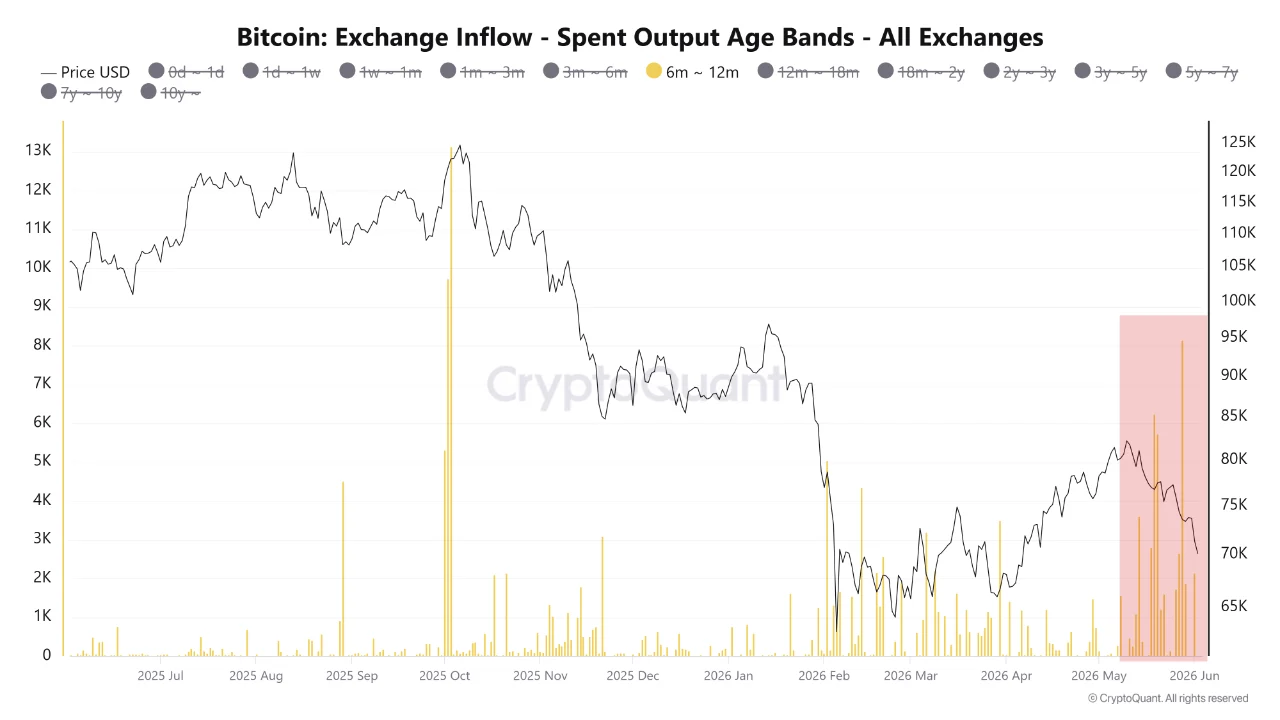 This cohort held through the January 2026 crash that pushed BTC below $65K. As price recovered into the $80K area in Q1–Q2 2026, CryptoQuant data confirms these holders began moving supply back onto exchanges, creating a sell ceiling that contributed directly to the rejection from $80K and the slide now reflected in the $68,900 print. The dense cluster of yellow spikes in the chart’s highlighted zone, concentrated in May–June 2026, confirms the distribution is ongoing rather than exhausted.
The arithmetic is direct: this cohort accumulated near $100K, survived a 35%+ drawdown, and is now distributing into a partial recovery that never reclaimed their entry zone. At $68,900 they remain underwater on average cost. That makes this loss mitigation rather than profit-taking, a distinction that matters because loss-motivated sellers are historically less price-sensitive and more persistent than profit-driven distributors.
Macro Overlap: The November 2025 Comparison Inverts
The last comparable inflow reading occurred on November 20, 2025, while BTC was ascending through $90K. Demand absorbed that supply and price continued higher toward cycle highs. The current $9.197B reading arrives at $68,900, on the downside of a failed recovery, with $70K now acting as resistance rather than support.
That inversion is the critical distinction. Retail inflows during uptrends reflect positioning for further gains. Retail inflows below a broken support level reflect reactive selling from holders moving coins to exchanges as price deteriorates beneath key thresholds. The simultaneous presence of 6m–12m cohort distribution, loss-motivated and volume-sustained across multiple consecutive weeks in the age band data, alongside reactive retail inflows at this price level, compounds sell-side pressure in a way neither signal produces independently.
Risk Analysis: Levels and Absorption Thresholds to Watch
At $68,900, Bitcoin has already breached the $70K threshold where derivative cascading has historically activated. The immediate structural question is whether spot demand absorbs the combined retail and 6m–12m supply before that cascading deepens. If the 10–100 BTC bracket’s daily exchange contribution normalizes within the next 48–72 hours while price stabilizes, the current move may resolve as a capitulation flush, with supply exhaustion establishing a local demand floor.
If the 6m–12m age band sustains its current inflow volume alongside continued mid-size wallet deposits, the $65K–$66K January 2026 correction low becomes the first structural test with no intermediate demand zone between current price and that level.
The information provided in this article is for educational purposes only and does not constitute financial, investment, or trading advice. Coindoo.com does not endorse or recommend any specific investment strategy or cryptocurrency. Always conduct your own research and consult with a licensed financial advisor before making any investment decisions.
The post Bitcoin Drops Under $69K as Retail Inflow Hits 6-Month High appeared first on Coindoo.