Bitcoin starts the third week of October by defending support at $80,000. At the time of writing, BTC trades near $83,437, up 0.48% in the last 24 hours. The total crypto market cap is hoveri
Bitcoin starts the third week of October by defending support at $80,000. At the time of writing, BTC trades near $83,437, up 0.48% in the last 24 hours.
The total crypto market cap is hovering near $2.8 trillion. Traders are waiting for the US CPI report, due today.
So, will BTC crash, or can it bounce from here? Here is what the data says.
Bitcoin Price Today: Where Is BTC Trading Now?
BTC is up $398.59 on the day. Its market cap stands at $1.67 trillion.
Activity is cooling, though. Futures volume fell 24.71% to $47.79 billion. Spot volume is $4.08 billion.
The circulating supply is 20.09 million BTC. The max supply is 21 million.
Metric
Value
BTC price
$83,437.3
24h change
+0.48% (+$398.59)
Market cap
$1.67 trillion
Futures volume (24h)
$47.79 billion
Spot volume (24h)
$4.08 billion
Open interest
$51.83 billion
Circulating supply
20.09 million BTC
Max supply
21 million BTC
Why Is the Bitcoin Price Moving Today?
Three things are in focus for Bitcoin. The CPI report, the Fed meeting on Oct. 28, and steady buying in spot ETFs.
Fuel prices add to the mood. Military action in the Middle East has pushed them higher, and that keeps inflation on traders' minds.
Short sellers also felt more pain than longs over the last 24 hours. More on that below.
Bitcoin News Today: Why Is the CPI Report a Big Deal?
The September CPI report comes out today. PPI follows on Thursday.
Both land just before the Fed meeting. That is why the Bitcoin CPI setup is on every trader's radar.
August CPI came in at 3.4% year-on-year. Markets now expect 3.7% for September.
Data
August
September (expected)
CPI (year on year)
3.4%
3.7%
PPI (month on month)
0.2%
0.3%
One market watcher said a cooler reading would be the clearest near-term catalyst. It would lower the odds of more Fed tightening and ease pressure on real yields.
A hotter reading could push the other way.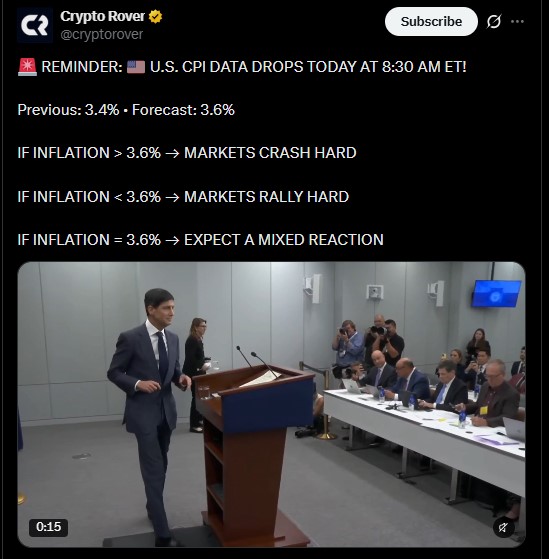
What Are the Fed Rate Hike Odds for October 28?
CME FedWatch shows a 21.6% chance of a hike from the current 3.75% to 4.00% range. The odds of no change are 78.4%. A cut is priced at 0%.
Hike odds have crept up from 17.7% a week ago. A month ago, they stood at 43.5%.
December looks tougher. Markets see 70.80% odds of a 25 basis point hike to 4.00% to 4.25%.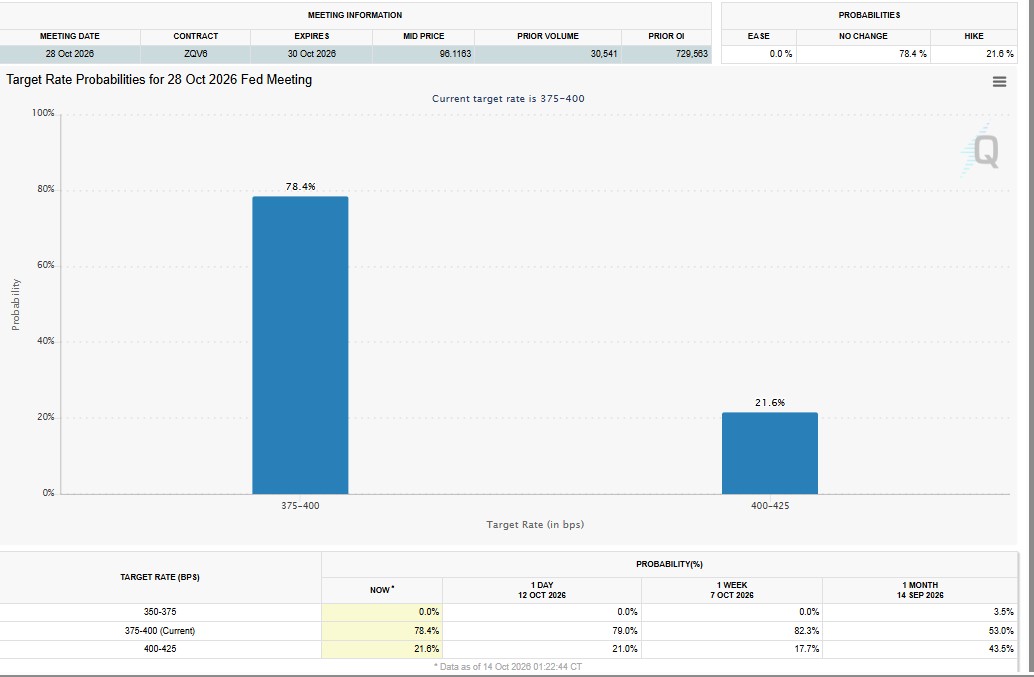
Time
Cut
No change
Hike
Now
0.0%
78.4%
21.6%
1 day ago
0.0%
79.0%
21.0%
1 week ago
0.0%
82.3%
17.7%
1 month ago
3.5%
53.0%
43.5%
BTC News Today: Are Bitcoin ETFs Still Buying?
Yes, for now. US spot Bitcoin ETFs recorded $175.62 million in net inflows on Oct. 13, according to SoSoValue.
Fidelity's FBTC led with $103.06 million. BlackRock's IBIT added $65.89 million. Morgan Stanley's MSBT brought in $6.67 million.
Total value traded across the funds was $1.65 billion. Total net assets are $106.98 billion, or 6.38% of the BTC market cap.
Cumulative net inflows sit at $57.22 billion. Other funds, including Grayscale's GBTC, saw no flows that day.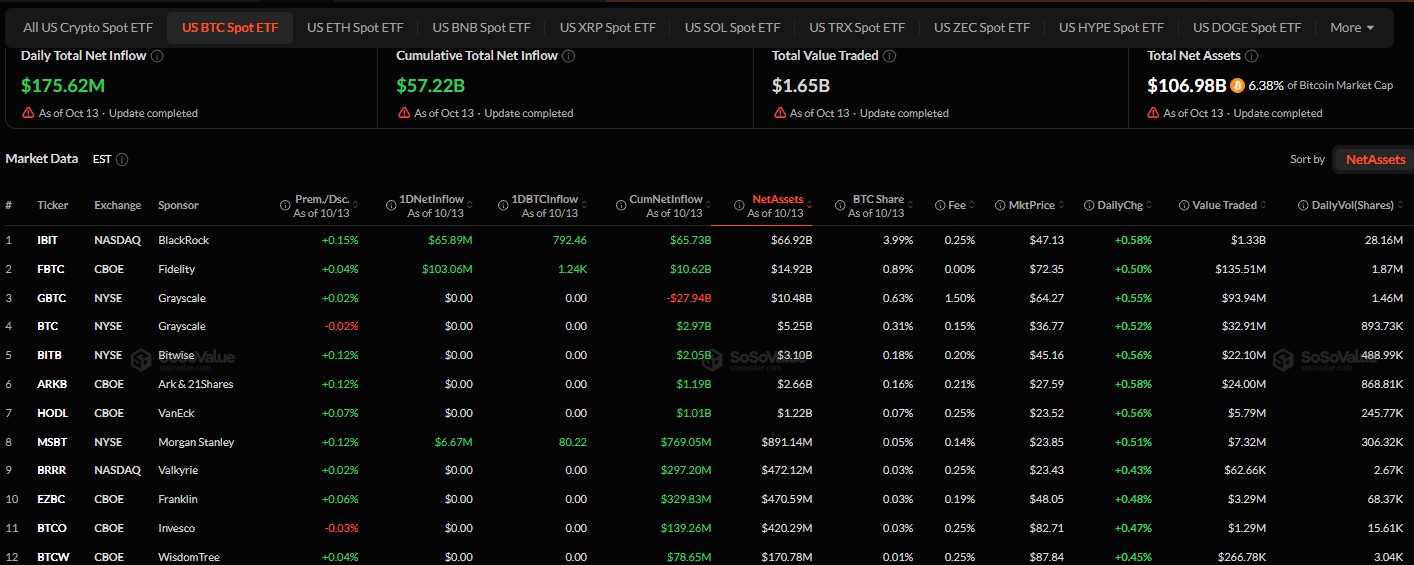
Fund
Sponsor
Net inflow (Oct. 13)
FBTC
Fidelity
$103.06M
IBIT
BlackRock
$65.89M
MSBT
Morgan Stanley
$6.67M
Total
$175.62M
BTC Price Analysis: Is Bitcoin Bullish or Bearish Right Now?
The picture is mixed. The overall 24-hour long/short ratio is 0.9406, a slight edge for shorts.
Exchange data tells another story. Accounts on Binance, OKX, and among top traders lean long.
Source
Long/short ratio
Overall (24h)
0.9406
Binance BTC/USDT (accounts)
1.2826
OKX BTC (accounts)
1.31
Binance top traders (accounts)
1.3557
Binance top traders (positions)
1.5188
Open interest is down 2.15%. Options open interest rose 1.50% to $39.38 billion, while options volume fell 18.42% to $3.78 billion.
In simple terms, fewer trades are happening, but more options contracts are staying open.
Liquidations were light. About $19.52 million was wiped out in 24 hours, and shorts took the bigger hit.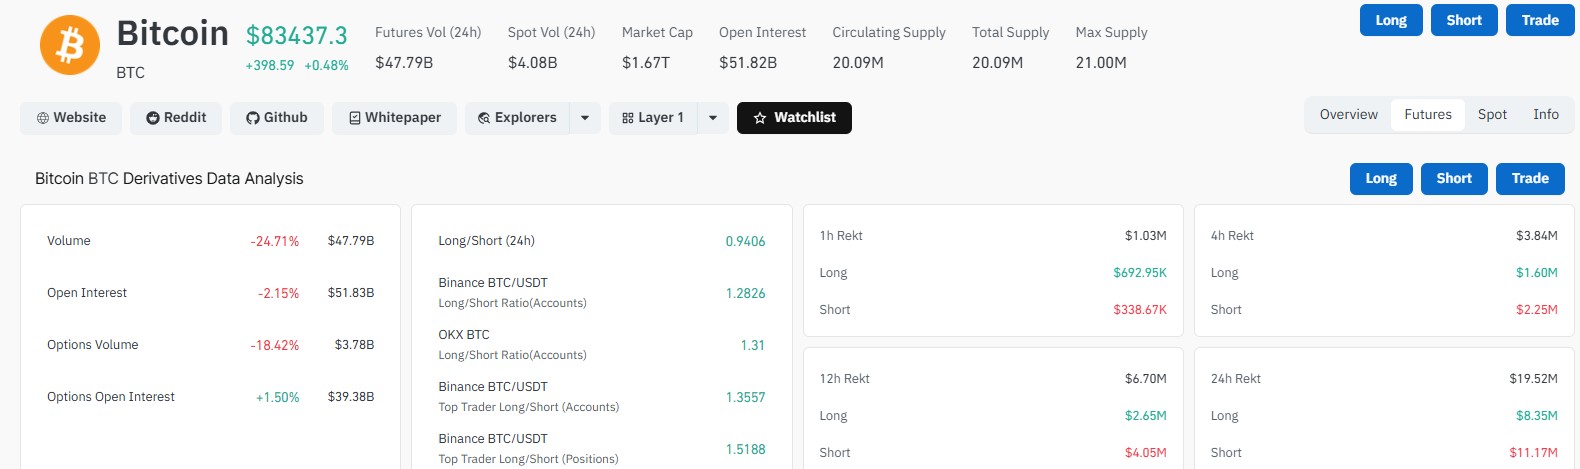
Period
Total
Longs
Shorts
1 hour
$1.03M
$692.95K
$338.67K
4 hours
$3.84M
$1.60M
$2.25M
12 hours
$6.70M
$2.65M
$4.05M
24 hours
$19.52M
$8.35M
$11.17M
Bitcoin Price Forecast: Can BTC Reach $88,000 and $93,000?
Crypto analyst Ali Charts says BTC is trading inside an ascending parallel channel on the 4-hour chart.
After a bounce from the lower boundary, BTC could move toward the mid-range at $88,000. If momentum continues, the next target is the channel top near $93,000.
From $83,437, the $88,000 level is about 5.5% higher. The $93,000 level is about 11.5% higher.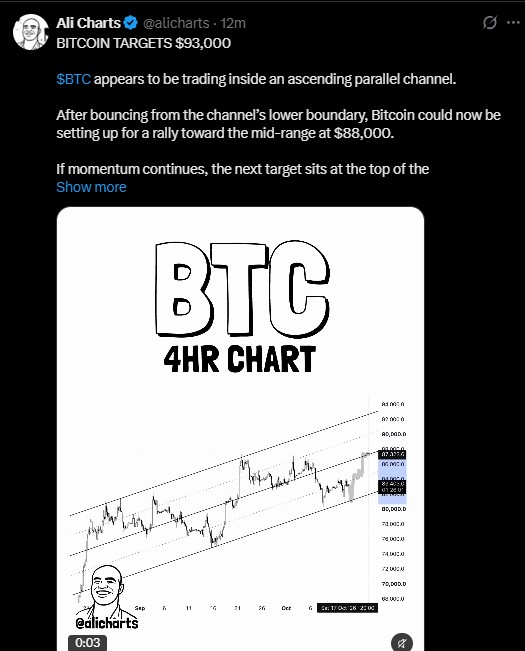
Level
Distance from $83,437
What it means
$93,000
About +11.5%
Top of the channel
$88,000
About +5.5%
Channel mid-range
$83,437
Current price
Trading near here
$80,000
About -4.1%
Key support
BTC Price Prediction: Will It Crash or Rally After CPI?
Nobody knows for sure. Both paths are open.
A cooler CPI could help the channel bounce. A hotter print, near or above 3.7%, could lift hike odds and put $80,000 back to the test.
A clear break below that level would weaken the channel view.
CPI result
What could happen
Level to watch
Cooler than 3.7%
Less pressure on yields, bounce may continue
$88,000, then $93,000
Near 3.7%
Mixed reaction, range trade
$80,000 to $88,000
Hotter than 3.7%
Hike odds may rise, more pressure
$80,000 support
What Should Traders Watch This Week?
A few dates and numbers matter most:
Today: US CPI for September.
Thursday: US PPI, expected at 0.3% month-on-month.
Daily: Spot ETF flows from SoSoValue.
Oct. 28: The Fed meeting, with 21.6% hike odds.
Price: The $80,000 support and the $88,000 mid-range.
Trading volume is lower, which hints that the market is waiting. Bitcoin holds its channel for now, and the CPI number will likely set the next move.
Disclaimer
This article is for information only. It is not financial, investment, or trading advice. Crypto prices are highly volatile, and you can lose some or all of your money. Price targets are not guaranteed. Always do your own research and speak with a licensed financial advisor before making any decision.