What to Know Bitcoin traded near $80,867, falling 3.2% below its October opening price and trailing historical average gains of 6.7% significantly. CryptoQuant analyst Andrew Kamsky highlight
What to Know
- Bitcoin traded near $80,867, falling 3.2% below its October opening price and trailing historical average gains of 6.7% significantly.
- CryptoQuant analyst Andrew Kamsky highlighted contrasting October performances, including Bitcoin’s 2022 recovery, strong 2023 gains, and weaker 2018 returns.
- Bitcoin faces critical support near $80,400, with a confirmed breakdown potentially exposing lower price levels around $77,000 and $73,500.
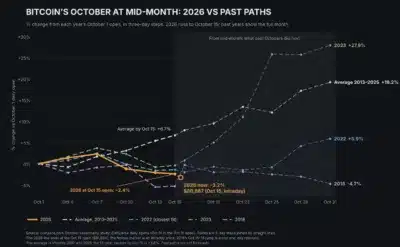
Bitcoin approached the $80,400 support level as October losses widened, falling below its opening price of $83,576. According to CryptoQuant analyst Andrew Kamsky, Bitcoin traded near $80,867 on October 15, marking a 3.2% decline against historical average gains of 6.7% and a median increase of 3.8%.
Bitcoin’s Previous October Results Show Different Recovery Patterns
Kamsky compared Bitcoin’s current weakness with October 2022, when prices peaked around October 5 before turning negative near October 8. Bitcoin subsequently traded within a narrow range until October 25, eventually finishing the month 5.9% above its opening price.
Also Read: XRP Death Cross Nears as $1.34 Support Faces Critical Test
October 2023 followed a different pattern, with stronger gains emerging during the second half and pushing Bitcoin 27.9% higher by October 31. In contrast, Bitcoin ended October 2018 with a 4.7% decline, demonstrating that historical seasonal trends do not guarantee positive returns.
Source: CryptoQuant
Rising Wedge Breakdown Places Lower Bitcoin Support Levels in View
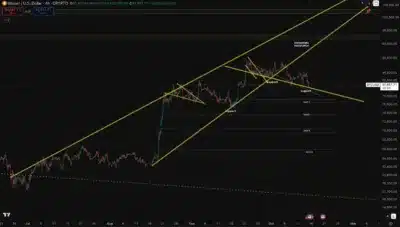
Beyond the historical comparison, Kamsky identified a breakdown below a rising wedge formation on Bitcoin’s four-hour chart. The pattern developed over three months, with prices testing both boundaries before breaking lower on October 7.
Source: CryptoQuant
Bitcoin subsequently approached trendline support near $80,400, close to the October 8 low, making that area significant. A sustained hold above this level could allow Bitcoin to revisit former wedge support, which now represents short-term resistance.
Alternatively, a confirmed four-hour close below the trendline would weaken the rebound scenario and expose consolidation zones. Kamsky identified $77,000 and $73,500 as potential support areas, followed by deeper levels around $70,000 and $64,000. Bitcoin’s response near $80,400 will determine whether the current decline stabilizes or extends toward those lower price levels.
Also Read: XRP Rebounds 5% as Binance Traders Record $184 Million in Buying Activity
The post Bitcoin Faces $80,400 Support Test as October Performance Falls Behind Historical Trends appeared first on 36Crypto.